Global Gender Gap Report, 2020
Published by World Economic Forum (WEF)
KEY HIGHLIGHTS:
India: 112/153 (previous year rank: 108/149)
Countries assessed on 4 dimensions:
(1) Economic Participation and Opportunity,
(2) Educational Attainment,
(3) Health and Survival,
(4) Political Empowerment
Global Performance
- Top performers – Iceland, Norway, and Finland
- Worst performers – Yemen (153), Iraq (152), & Pakistan (151)
- Time it will take to close the gender gap – narrowed to 99.5
years (108 years in 2018). - Political empowerment – It has the largest gender disparity.
Only 25% parliament seats are occupied by women & only 21%
of ministers are women.
India’s Performance - Slipped down 4 places since last ranking.
- Ranks below countries like China (106), Sri Lanka (102), Nepal
(101), Brazil (92), Indonesia (85) & Bangladesh (50). - India has closed 2/3rd of its overall gender gap.
- India’s rank was the worst in the Health and Survival
parameter (150th) which is computed in terms of life expectancy
for women and sex ratio at birth. - Abnormally low sex ratios at birth (91 girls for every 100 boys).
- Economic opportunity – The gap has worsened (149th). Women
account for only 14% of leadership roles and 30% of
professional and technical workers. Female estimated earned
income is mere 1/5th of male income, among world’s lowest. - Political empowerment – India ranked 18th.
women make up only 14% of the parliament (122 nd) & 23% of the cabinet (69th). - India is the only country where economic gender gap > political
gender gap
Global Competitiveness Report & Index, 2019
| INDEX / REPORT | PUBLISHED BY | INDIA’S RANKING & KEY HIGHLIGHTS |
| Global Competitiveness Report & Index, 2019 | World Economic Forum (WEF) | India rank: 68/141 (Slipped down 10 ranks, from 58/140 in 2018) • It tracks data on 12 factors divided into 4 broad categories, Like Enabling Environment – for eg. state of infrastructure, institutions, the macroeconomic stability of the country and its ability to adopt new technology. Human Capital – includes health and level of skills in the economy. State of Markets – labour, product, financial & overall market size. Innovation Ecosystem – Business dynamism & innovation capability. • Top 5 Countries: Singapore, USA, Hong Kong, Netherlands, & Switzerland India’s performance Within South Asia, it is the best performer. Within BRICS, 2nd worst performer after Brazil. China is ranked 28th (the highest ranked among the BRICS). |
Ease of Doing Business, 2020
| INDEX / REPORT | PUBLISHED BY | INDIA’S RANKING & KEY HIGHLIGHTS |
| Ease of Doing Business, 2020 | World Bank | India Rank: 63/190 (India climbed 14 spots, from 77th position in 2018) • Assesses on 10 areas: Starting a business, dealing with construction permits, getting electricity, registering property, getting credit, protecting minority investors, paying taxes, trading across borders, enforcing contracts, and resolving insolvency. • Distance to frontier (DTF), a score that shows the gap of an economy to the global best practice. • Top 3 Performers – New Zealand, Singapore and Hong Kong Somalia was ranked the last (190) • India’s Performance India recognized as one of the top 10 improvers for the 3rd year, consecutively. Improved its rank in 7 out of 10 indicators. 4 areas of major progress – Resolving Insolvency (from 108th to 52nd), Dealing with Construction Permits (from 52nd to 27th), Trading Across Borders (from 80th to 68th), and Starting a Business (from 137th to 136th). Ranking deteriorated on 2 parameters – protecting minority investors(from 7th to 13th position) and getting credit (from 22nd to 25th). |
World Development Report, 2020 by World Bank
• Theme: “Trading for Development in Age of Global Value Chains”
• 2020 report examines whether there is still a path to development
through Global Value Chains (GVCs) and trade.
• Value Chain – It refers to the full life cycle of a product or process,
including material sourcing, production, consumption and disposal/
recycling processes.
Global Value Chain (GVC)
- A GVC breaks up the production process across countries.
- Firms specialize in a specific task & do not produce the whole
product. - Each stage adds value, and at least two stages are in different
countries. - Economic fundamentals drive countries’ participation in GVCs
and national policies aid in enhancing participation &
broadening benefits.
The Report concludes that GVCs can continue to boost growth,
create better jobs, and reduce poverty, provided that developing
countries undertake deeper reforms and industrial countries
pursue open, predictable policies.
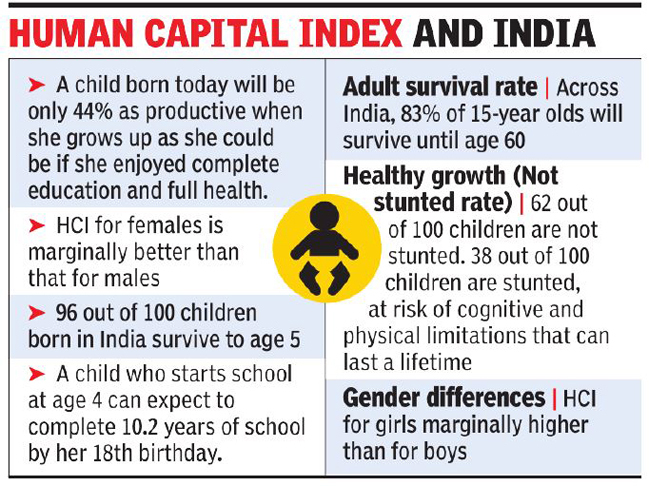
Human Capital Index (HCI), 2019 by World Bank
India Rank: 115/157
• First HCI released as part of the World Development Report 2019.
• It has 3 components:
- Survival, as measured by under-5 mortality rates.
- Expected years of Quality-Adjusted School
- Health environment – Adult survival rates & Rate of stunting
for children under 5.
India: 0.44 score. (Productivity lower than Nepal, Sri Lanka, Myanmar, and Bangladesh)
(*Note – HCI is different from HDI (Human Development Index)
which is published by UNDP)
Global Economic Prospects Report, 2020 (Semi- annual report) BY World Bank
• Global economic growth is expected to rise to 2.5%
• The report predicts India’s growth rate at 5% in FY 2020 (2019-20).
• This is the lowest prediction since 2008-09 (3.1%) ie. in 11 years.
• Reasons – insufficient credit availability and subdued private
consumption.
• Growth in advanced economies is likely to slip to 1.4%
• Growth in the emerging markets and developing economies is expected to accelerate this year to 4.1%
Global Social Mobility Report, 2020 BY World Economic Forum (WEF)
India Rank: 76/82
• The index focusses on those policies, practices and institutions that
collectively determine the extent to which everyone in society has
a fair chance to fulfil their potential, regardless of their socioeconomic background.
Social mobility can be understood as moving ‘upward’ and
‘downward’, whereby people see their circumstances become
better or worse off than those of their parents or within their own
lifetimes.
Absolute upward social mobility refers to the ability for children
to experience a better life than their parents.
Assesses on 5 key dimensions of social mobility, over 10 pillars:
- Health
- Education (access, quality/equity, lifelong learning)
- Technology
- Work (opportunities, wages, conditions)
- Protection Institutions (social protection & inclusive institutions)
• Top 5 performers – Denmark, Norway, Finland, Sweden and Iceland
(All are Nordic nations).
• Increasing social mobility by 10% would benefit social cohesion and
boost the world’s economies by nearly 5% by 2030.
• Economies that stand to gain the most from increases in social
mobility are China, US, India, Japan, Germany, Russia, Indonesia,
Brazil, the UK and France.
• It calls for a new financing model for social mobility: Improving tax
progressivity on personal income, policies that address wealth
concentration and broadly rebalancing the sources of taxation.
Global Risks Report, 2020 by World Economic Forum (WEF)
A “global risk” is defined as an uncertain event or condition that, if it
occurs, can cause significant negative impact for several countries or
industries within the next 10 years.
Top 5 global risks in terms of likelihood are —
- Extreme weather conditions (floods, storms).
- Climate action failure (Failure of climate-change mitigation &
adaptation). - Major natural disasters (earthquakes, tsunamis, volcanic
eruptions, geomagnetic storms etc.). - Major biodiversity loss & ecosystem collapse (terrestrial/marine)
- Human-made environmental damage and disasters (oil spills,
radioactive contamination).
| INDEX / REPORT | PUBLISHED BY | KEY HIGHLIGHTS |
| Travel and Tourism Competitiveness Report & Index, 2019 | World Economic Forum (WEF) | India Rank: 34/140 • Theme: Travel and Tourism at a Tipping Point (Biennial report) • Scores countries on 4 indicators — (1) enabling environment; (2) travel and tourism policy and enabling conditions; (3) infrastructure; (4) natural and cultural rankings. • India’s performance – India had the greatest improvement (40th to 34th), over 2017, among the top 25% of all countries ranked. |
| Global Energy Transition Index, 2019 | World Economic Forum (WEF) | India Rank: 76/115 • Top performer – Sweden • The index benchmarks the countries’ energy systems based on an “energy triangle” – (1) Energy security and access, (2) Economic development growth, & (3) Environmental sustainability • India is 2nd in the BRICS group, after Brazil. |
| Global Environmental Performance Index, 2018 | World Economic Forum (WEF) | India Rank: 177/180 (India slipped down from previous year) • Developed by Yale University and Columbia University in collaboration with WEF and Joint Research Centre of European Commission. • India ranked 4th worst country in curbing environmental pollution. |
| Inclusive Development Index, 2018 | World Economic Forum (WEF) | India Rank: 62/74 (among Emerging economies) • 3 Pillars of Index – (1) Growth and Development, (2) Inclusion and Intergenerational Equity & (3) Sustainability • Calculated separately for Advanced & Emerging economies • India ranked below Pakistan (47), Sri Lanka (40) & Nepal (22) • India 2nd last among G 20 economies. |
| Global Manufacturing Index, 2018 | World Economic Forum (WEF) | India Rank: 30 (among Legacy group) • 100 countries divided into 4 groups: 1. Leading (strong current base, high level of readiness for future) 2. High Potential (limited current base, high potential future) 3. Legacy (strong current base, at risk for future) 4. Nascent (limited current base, low level of readiness for future) |
| Logistics Performance Index, 2018 | World Bank | India Rank: 44 (slipped down from 35th rank) • India Logistics costs – 13-14% of GDP vs 8% developed nations |
| Remittances Report, 2019 | World Bank | • India – World’s top recipient of remittances ($79 billion) • Followed by China ($67 billion), Mexico ($36 billion), Philippines ($34 billion), and Egypt ($29 billion) |
| World Economic Outlook, April 2020 | International Monetary Fund (IMF) | • Covid-19 pandemic will shrink world output by 3% in 2020. • It will grow by 5.8% in 2021, helped by policy support (assuming Covid19 pandemic fades in 2 nd half of 2020). • India is a projected to grow by 1.9% in 2020 (down from its Jan 2020 projection of 5.8%) and 7.4% in 2021. |
| Global Financial Stability Report, 2019 | International Monetary Fund (IMF) | Key Vulnerabilities in the Global Financial System: • Rising corporate debt burdens • Increasing holdings of riskier and more illiquid assets by institutional investors • Greater reliance on external borrowing by emerging market and frontier economies |
| Social Institutions and Gender Index (SIGI), 2019 | OECD | • SIGI is a cross-country measure of discrimination against women in social institutions (formal and informal laws, social norms, and practices). • Top 3 performers: Denmark, Sweden and France • India is categorized in Medium level of discrimination (SIGI – 34%) |
To be continued….