Human Development Report & Index, 2019
Title: Beyond Income, Beyond Averages, Beyond Today: Inequalities in Human Development in the 21st Century.
By United Nations Development Programme (UNDP)
Indices that form part of Human Development Report’19
- Human Development Index (HDI)
- Inequality-adjusted Human Development Index (IHDI)
- Gender Development Index (GDI)
- Gender Inequality Index (GII)
- Multidimensional Poverty Index (MPI)
- India Rank: HDI – 129/189 (moved up from 130th Rank
- Measured using 3 parameters
- Health – Life expectancy at birth.
- Education – expected years schooling for school-age
children and mean years of schooling in the adult
population. - Income – Gross National Income (GNI) per capita (PPP)
Top Performers – Norway, Switzerland, Ireland.
• Burundi is at the bottom.
• India’s HDI value has marginally increased to 0.647.
• Among India’s neighbours, Sri Lanka (71) and China (85) are
higher up the rank scale.
*Note: Pakistani economist Mahbub ul Haq created HDI in 1990

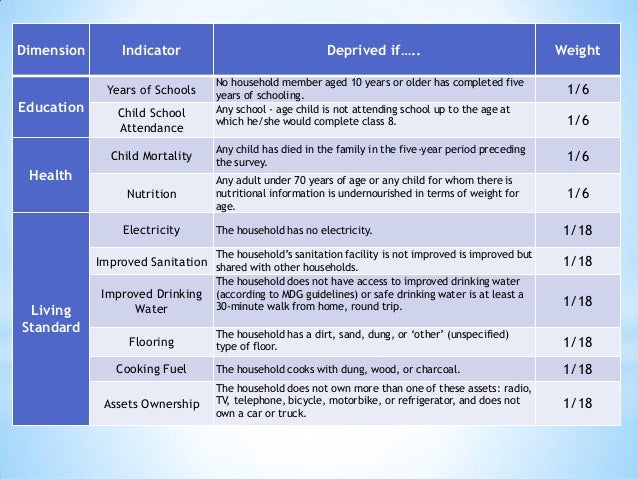
Multidimensional Poverty Index, 2019
By UNDP and Oxford Poverty & Human Development Initiative (OPHI)
• Value: 1: Highest Deprivation, 0: Lowest Deprivation
• It measures multiple deprivations in education, health and living standards, on the basis of 10 indicators.
• A person is multi-dimensionally poor if deprived in at least 3 of
the 10 dimensions.
• Across 101 countries, 23% are multidimensionally poor.
• India MPI: 0.123 (less than world average – 0.159)
- India accounts for 28% of 1.3 billion multidimensional poor.
- India reduced its MPI values the fastest (2006-2016). It lifted 271 million people out of poverty.

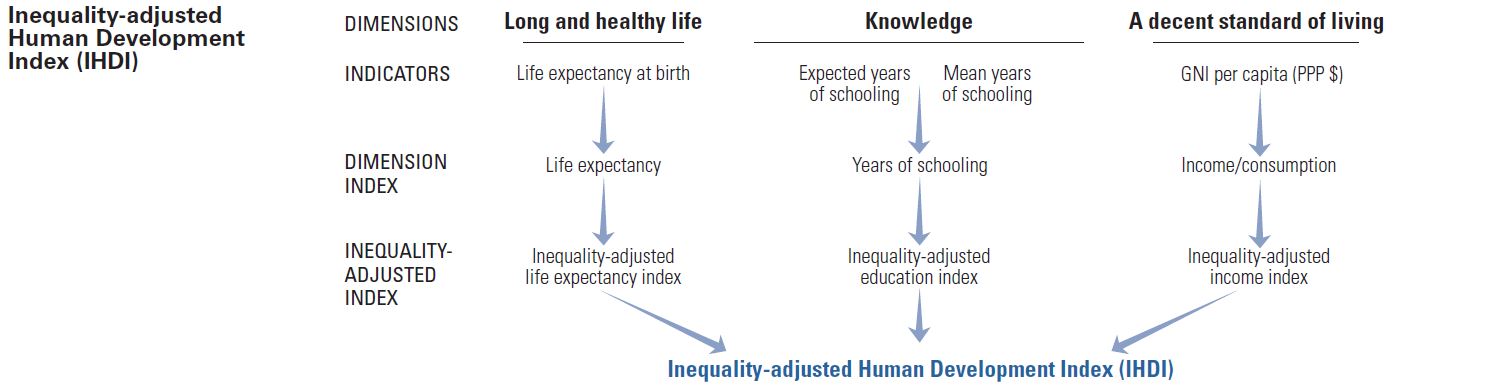
Inequality-adjusted HDI (IHDI), 2019
By UNDP
India Rank: 130 (dropped by 1 position)
• The IHDI indicates percentage loss in HDI due to inequalities.
• India lost nearly half the progress(0.647 to 0.477) made in the past 30 years.
IHDI is distribution-sensitive average level of human development. Two countries with different distributions of achievements can have the same average HDI value. Under perfect equality the IHDI is equal to the HDI, but falls below the HDI when inequality rises.
The difference between the IHDI and HDI is the human development cost of inequality, also termed – the overall loss to human development due to inequality.
Gender Inequality Index, 2019
By UNDP
India Rank: 122/621
• World is not on track to achieve gender equality by 2030 as per the UN’s SDG.
• It may take 202 years to close the gender gap in economic opportunity.
• China (39), Sri Lanka (86), Bhutan (99), Myanmar (106) placed above India.

Gender Parity Index: By UNESCO
- Gender Parity Index in primary, secondary and tertiary education is the ratio of the number of female students enrolled at primary, secondary and tertiary levels of education to the number of male students in each level.
- In short, GPI at various levels reflect equitable participation of girls in the School system.
A GPI of 1 indicates parity between the sexes; a GPI that varies between 0 and 1 typically means a disparity in favour of males; whereas a GPI greater than 1 indicates a disparity in favour of females.
- India’s GPI for the year 2018-19 at different levels of School Education is as under:
- Primary Education: 1.03
- Upper Primary Education: 1.12
- Secondary Education: 1.04
- Higher Secondary Education: 1.04
- India’s GPI indicates that the number of girls is more than the number of boys at all levels of school Education.
World Economic Situation and Prospects 2020
The United Nations Conference on Trade and Development (UNCTAD), United Nations Department of Economic and Social Affairs (UN DESA) and the five United Nations Regional Economic Commissions have jointly released the World Economic Situation and Prospects 2020 (WESP).
- The report warns about strong economic risks, deep political polarization and increasing scepticism about the benefits of multilateralism.
India
- Rate of economic expansion fell sharply from 6.8% in 2018
to 5.7% in 2019. - Economic growth is expected to return to 6.6% in 2020,
with inflation close to 4%. - India may be among a few countries where the per capita
GDP growth rate could exceed 4% level in 2020.
International Migrant Stock 2019
By Population Division of the UN Department of Economic and Social Affairs
• It provides the latest estimates of the number of international migrants by age, sex and origin for all countries of the world.
• India has emerged as the leading country of origin for immigrants across the world.
• 50% of all international migrants reside in just 10 countries – USA > Germany & S. Arabia > Russia
• 1/3rd of all international migrants originate from only 10 countries – India > Mexico > China.
• Highest number (>60%) of international migrants in India came from Bangladesh.
To be continued…..