IIP is a short term indicator of industrial growth till the results from Annual Survey of Industries (ASI) and National Accounts Statistics (Eg: GDP) are available.
The base year of the index is given a value of 100. So, if the current IIP reads 180, it means that there has been 80% industrial growth compared to the base year, ie 2011-12.
IIP is compiled and published by Central Statistics Office(CSO). It is published every month
It covers 865 (Older series 682) items comprising :
- Manufacturing (809 items, Older series 620 items),
- Mining (55 items, Older Series 61 items) &
- Electricity (1 item).
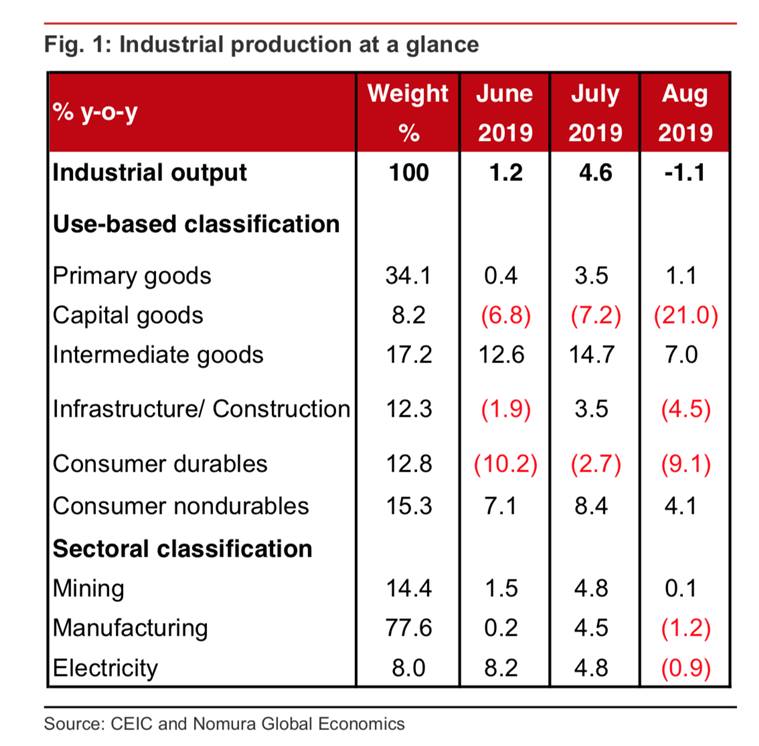
The weights of the three sectors are :
- Manufacturing – 77.63%,
- Mining – 14.37%,
- Electricity – 7.99%
It is calculated on the basis of their share of GDP at factor cost during 2011-12.
The eight Core Industries comprise nearly 40.27 % of the weight of items included in IIP. They are :
- Coal (10.33%)
- Crude oil (8.98%)
- Natural gas (6.88%)
- Refinery products (28.04%)
- Fertilisers (2.63%)
- Steel (17.92%)
- Cement (5.37%)
- Electricity (19.85%)
In IIP, the decreasing order of core industries among them is as: REFINERY PRODUCTS>ELECTRICITY> STEEL> COAL> CRUDE OIL> NATURAL GAS>CEMENT> FERTILIZERS
Main Changes:
Base year has been changed from 2004-05 to 2011-12. There will be 407 item groups
The new series of IIP will include technology items like smart phones, tablets, LED television etc. A technical review committee has also been established to identify new items by ensuring that the series remains relevant. The committee is slated to meet at least once a year.
The revised IIP (2011-12) reflects the changes in industrial sector and also aligns it with base year of other macroeconomic indicators like Wholesale Price Index (WPI) and Gross Domestic Product (GDP).
IIP measures actual production output across the industrial sector. Significantly, IIP for December 2017 would be reckoned with the same month in 2016, unlike PMI, which is monthly comparison.
As it is a comparison over the previous year, it is season neutral. Therefore, as the basis of IIP and PMI are different, a comparison between the two is really not appropriate.
However, as the PMI is released on the 1st of every month and the IIP is known on the 12th, the PMI score is assumed to be a precursor to the IIP. But the correlation between PMI and IIP isn’t strong and the relationship between the two variables is quite low and insignificant.