Content
- What Will Power AI Data Centres?
- Sardar Patel’s Vision and Meaning of National Unity Today
- Building a Sustainable and Inclusive Future with Indian PSUs
- In U-turn, US Gives 6-Month Sanction Relief to Chabahar
- After ASEAN Summit: Group’s Importance for India amid US–China Tussle
- Land beneath India’s five largest cities is sinking due to over-extraction of groundwater: Study
What will power AI data centres?
Why in News ?
- India’s electricity demand, stagnant at around 5% annual growth for two decades, is now rising rapidly due to new high-energy sectors.
- Key demand drivers: AI & Data Centres, Electric Vehicles (EVs), 5G/IoT, green hydrogen, and digital economy expansion.
- The US, China, and Big Tech firms are already witnessing 25%+ annual power demand surges from AI data centres.
- India is planning GW-scale AI data centres (Google at Visakhapatnam, Reliance at Jamnagar) and exploring Small Modular Reactors (SMRs) as clean, reliable energy sources for them.
- The Union Budget 2025 launched a ₹20,000 crore Nuclear Energy Mission to add 100 GW nuclear capacity by 2047, including SMRs.
Relevance:
- GS 3 – Energy, Infrastructure, and Technology: AI-driven electricity demand, sustainable energy mix, nuclear innovation through Small Modular Reactors (SMRs), and linkage with the IndiaAI Mission.
- GS 2 – Governance and Policy: Inter-ministerial coordination between MeitY, MoP, and DAE for energy–technology convergence; clean energy policies under Budget 2025; regulatory reforms for private participation in nuclear energy.
- GS 3 – Environment: Low-carbon power strategy, Net Zero 2070 alignment, and sustainable infrastructure for digital economy expansion.
Background: India’s Power Demand Trends
- Past 20 years: Electricity demand grew at ~5% annually — relatively stable due to efficient grids, low industrial expansion, and moderated population growth.
- Shift (post-2023): Rise in data traffic, EV charging, AI computation, and green hydrogen manufacturing expected to double electricity demand by 2030.
- India’s per capita electricity consumption (2025): ~1,350 kWh — 1/3rd of global average (~4,000 kWh), but projected to rise steeply.
- Planning challenge: Aligning digital economy growth with sustainable, low-carbon electricity expansion.
Why India Needs Data Centres
- Digital India Mission, data localisation laws, and explosive data usage demand domestic storage and processing capacity.
- Current capacity: 1.4 GW
- vs. Europe: 10 GW
- India has 2× more internet users than Europe, yet 1/7th capacity.
- Expected growth:
- By 2027: 2–3× increase (to ~4 GW).
- By 2030: >5× increase (to ~7–8 GW) with AI and LLM infrastructure.
- Drivers:
- Data privacy & localisation mandates.
- 5G and IoT ecosystem.
- Cloud computing, fintech, and generative AI expansion.
Power Demand from AI Data Centres
- Traditional server racks: 15–20 kW.
- AI/LLM GPU racks: 80–150 kW (≈6× higher load).
- Global data centre electricity usage:
- 2024: ~460 TWh
- 2030 (projection): ~1,000 TWh
- 2035: ~1,300 TWh (~6% of global generation).
- Case studies:
- China:
- Data centre electricity use to reach 400+ billion kWh by 2025 (~4% of total power).
- CAGR ~18% (2023–2030).
- US (Dominion, Virginia):
- Electricity and peak demand projected to rise >25% in 5 years due to data centres.
- China:
Data Centre Hubs: Global and Indian
Global
- US: 51% of global capacity — hubs in Texas, Virginia, Ohio, Phoenix, Wisconsin, Pennsylvania.
- Other nations: China, Norway, UK, Germany, Japan, Malaysia investing in AI-grade infrastructure.
India
- Emerging AI data centre clusters:
- Visakhapatnam (Google) – GW-scale, AI-optimised.
- Jamnagar (Reliance Industries) – part of IndiaAI Mission.
- Mumbai, Chennai, Bengaluru, Hyderabad – existing hyperscale hubs (Yotta, AdaniConneX, Sify, CtrlS).
- IndiaAI Mission (2024):
- Focus on indigenous AI models, large-scale compute infrastructure, and clean energy linkages.
Powering the AI Era: Energy Mix Options
Renewables
- Solar, wind, and hydro as clean options but intermittent and storage-dependent.
- Storage (battery, pumped hydro) still developing — costly for 24/7 AI operations.
Natural Gas & Green Hydrogen
- Used as backup for renewables ensuring grid reliability.
- Hydrogen blending and onsite generation emerging in industrial clusters.
Emerging Alternatives
- Geothermal energy (pilot projects in Ladakh & Gujarat).
- Nuclear fusion research under ITER collaboration (long-term).
Small Modular Reactors (SMRs) – The Key Innovation
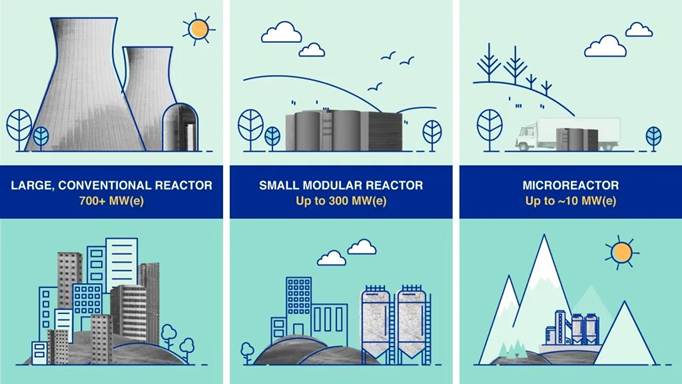
- SMRs emerging as reliable, low-carbon baseload solution for AI data centres.
- Range: 1–300+ MW capacity.
- Advantages:
- Modular, factory-built → faster deployment.
- Passive safety systems → no human/manual intervention needed.
- Can be located near consumption hubs → no transmission losses.
- Flexible for remote/industrial sites.
Global Investment & Regulation in SMRs
Investment Landscape
- Total global SMR investment: $15.4 billion
- $10 billion – public funding
- $5.4 billion – private capital (tech & energy companies)
- Big Tech (Google, Microsoft, Amazon) exploring SMR power purchase deals for AI facilities.
Regulatory Reforms (Global Trends)
Six key areas of SMR regulation evolving internationally:
- Technology-neutral frameworks (beyond large LWR models).
- Streamlined licensing – combined construction-operating licences.
- Fleet-wide approvals – enabling standardised mass deployment.
- Factory certification – for modular manufacturing.
- Risk-informed requirements – proportional safety zones.
- International harmonisation – via IAEA standards & mutual recognition.
Leading Regulatory Models
- U.S. ADVANCE Act (2024) – accelerates SMR licensing.
- Canada – Vendor Design Review (pre-licensing pathway).
- UK – Regulatory sandbox approach.
- IAEA – Nuclear Harmonization and Standardization Initiative (NHSI).
India’s SMR Push
Budget 2025 Initiatives
- ₹20,000 crore outlay under Nuclear Energy Mission.
- Target: 100 GW nuclear capacity by 2047.
- IndiaAI–Nuclear synergy: Aligns AI infrastructure growth with clean baseload energy.
Key Developments
- BARC’s BSMR-200 – 200 MW Pressurised Heavy Water Reactor (PHWR) variant.
- 55 MW SMR for remote areas in isolated grid mode.
- Holtec–India partnership for technology transfer.
- Private participation reforms:
- Planned amendments to Atomic Energy Act (1962) & Civil Liability Act (2010).
- Aims to attract $26 billion private investment.
State-level Role
- Pre-approval of coal plant sites for SMR conversion.
- Land facilitation, safety training, and workforce reskilling.
- Demonstration projects integrated with green hydrogen hubs.
SMR Safety and Environmental Aspects
- Passive safety features:
- Natural convection cooling.
- Automated shutdown systems.
- Accident-tolerant fuels withstand higher temperatures.
- Waste & transport regulation:
- Need for new frameworks addressing factory fabrication, transport risks, and spent fuel disposal.
- HALEU fuel (high-assay low-enriched uranium) requires specific waste management protocols.
- IAEA support:
- SMR Regulators’ Forum.
- Safeguards by Design Programme – balancing safety, economics, and security.
Opportunities for India
- Energy Security – 24/7 baseload for AI infrastructure.
- Climate Goals – Low-carbon transition aligned with India’s Net Zero 2070 target.
- Export Potential – India can become SMR exporter to Global South via cost-effective indigenous tech.
- Industrial Repurposing – Utilize decommissioned coal plant sites.
- Employment & Skill Creation – Reskill coal workforce for nuclear operations.
Challenges Ahead
- Regulatory delays – outdated laws not suited for SMRs.
- Public perception & safety concerns.
- Financing barriers – high upfront capital cost despite modularity.
- Waste disposal & liability – still unresolved.
- Grid integration – ensuring SMR–renewable hybrid stability.
Core Takeaway
India’s next energy transition will be driven not just by renewables, but by AI-driven demand.
Data centres and SMRs together define the digital–nuclear nexus of the future — where clean, constant power meets the data economy, enabling India’s journey from Digital India to Energy-Secure India by 2047.
Sardar Patel’s vision and the meaning of national unity today
Why in News ?
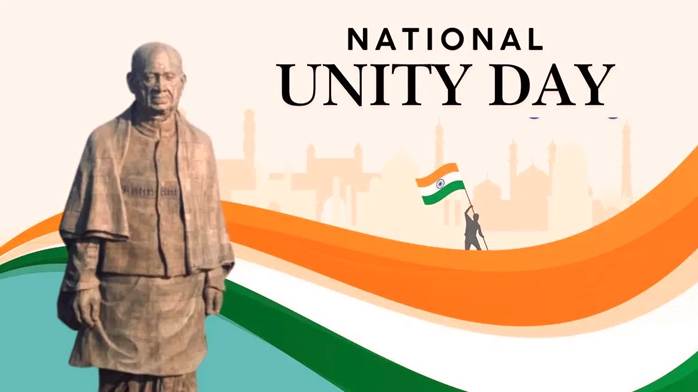
- October 31 marks Rashtriya Ekta Diwas (National Unity Day) — commemorating Sardar Vallabhbhai Patel’s birth anniversary (born in 1875).
- 2025 marks his 150th birth anniversary, celebrated through national events at Ekta Nagar, Gujarat — home to the 182-metre Statue of Unity, the world’s tallest statue.
- The theme underscores Patel’s nation-building legacy and the renewal of unity in India’s 21st-century diversity.
Relevance:
- GS 1 – Modern Indian History: Role of Sardar Patel in integrating princely states, building the Indian Union, and shaping post-Independence federal consolidation.
- GS 2 – Governance and Polity: Federalism, administrative unity through All India Services, and civic nationalism within constitutional democracy.
Background: Sardar Patel’s Historical Role
- Post-Independence Integration (1947–49):
- Unified 562+ princely states into the Indian Union through diplomacy, persuasion, and firmness.
- Handled key accessions — Junagarh, Hyderabad, Jammu & Kashmir — preventing potential fragmentation post-Partition.
- As Deputy PM & Home Minister, implemented a federal integration model balancing central authority with regional diversity.
- Vision of Unity:
- Not “uniformity” but a federation of minds and hearts, bound by shared civilizational ethos.
- Saw administrative unity as a foundation for political stability and national security.
Evolution of Rashtriya Ekta Diwas
- Institutionalized in 2014 by the Government of India.
- Objective: Reinforce that national unity is an ongoing project, not a historical achievement.
- Celebrated annually through:
- Run for Unity (public participation campaign).
- Integrity Pledge by citizens, civil servants, and students.
- Cultural and patriotic events nationwide promoting solidarity.
Patel’s Vision of Unity: Key Dimensions
Political Unity
- Integration of princely states ensured India’s territorial and constitutional integrity.
- Prevented Balkanization, enabling democratic consolidation.
Administrative Unity
- Advocated All India Services (IAS, IPS) for continuity and national cohesion.
- Believed a strong Centre was essential for India’s survival amid diversity.
Cultural Unity
- Emphasized India’s shared civilizational identity — plural yet unified.
- Saw culture as the emotional and moral fabric sustaining political unity.
Spiritual Unity
- Rooted in India’s ethos of “Sarva Dharma Sambhava” (equal respect for all faiths).
- Nationalism grounded in dharma and collective duty, not religious homogeneity.
Contemporary Meaning of National Unity (2025 Context)
Cultural Integration
- Programmes under Ministry of Culture:
- Ek Bharat Shreshtha Bharat (EBSB) – State/UT pairing for exchange of language, cuisine, festivals, and arts.
- Zonal Cultural Centres & National Museums – Promote regional art forms across India.
- Example: Maharashtra–Assam exchange (Lavani–Bihu) fosters mutual understanding.
Tourism as an Integrator
- ‘Dekho Apna Desh’ Campaign & ‘Incredible India’ Digital Revamp promote domestic cultural tourism.
- 2024 Data: Over 294 crore domestic visits, indicating rising citizen engagement with national heritage.
- Schemes:
- Swadesh Darshan – Theme-based tourism circuits linking heritage & livelihood.
- PRASHAD – Pilgrimage rejuvenation linking faith, tourism, and unity.
- Local livelihood impact: Homestays, handicrafts, and intercultural exchanges (e.g., Nagaland–Gujarat crafts).
Institutional and Policy Unity
- Panch Pran of Amrit Kaal (2022–2047) reinforce unity as national purpose:
- Goal of developed India by 2047.
- Eradication of colonial mindset.
- Pride in heritage.
- Strengthening unity and solidarity.
- Duty of citizens towards nation-building.
Unity through Culture and Connectivity
- Cultural diplomacy strengthens internal cohesion by celebrating regional contributions.
- Digital platforms (National Mission on Cultural Mapping, Indian Heritage App) integrate citizens with shared narratives.
- Inter-state festivals, student exchanges, and tourism circuits convert diversity into experiential unity.
Challenges to Unity Today
- Regionalism and linguistic chauvinism challenging federal balance.
- Socio-economic inequalities creating internal divides.
- Misinformation and polarization fragmenting social cohesion.
- Neglect of cultural literacy leading to loss of shared heritage consciousness.
Way Forward
- Strengthen Cultural Federalism – Recognize diversity as an instrument of national cohesion.
- Inclusive Development – Balance between regional aspirations and national priorities.
- Civic Nationalism – Move beyond identity politics toward constitutional patriotism.
- Cultural Education – Embed civilizational understanding in school curricula.
- Digital Integration – Use technology to connect youth across states through shared platforms.
Core Takeaway
Sardar Patel’s unity was not just geographical consolidation — it was emotional, cultural, and civic integration.
In 2025, his legacy endures as India’s moral compass — reminding that national unity is a continuous collective effort, renewed through participation, inclusivity, and pride in diversity.
Building Sustainable and Inclusive Future with Indian PSUs
Why in News ?
- FY 2023–24 CSR data shows Public Sector Undertakings (PSUs) have emerged as the largest contributors to India’s CSR spending.
- Total CSR expenditure rose to ₹29,987 crore (up from ₹26,209 crore in FY 2022–23).
- PSU contribution: ₹5,000 crore, a 19% increase year-on-year — reflecting the integration of sustainability and inclusion into corporate strategy.
Relevance:
- GS Paper 2 – Governance: CSR as a tool for inclusive governance, policy–corporate convergence, and role of PSUs in social transformation.
- GS Paper 3 – Economy and Sustainable Development: ESG integration, CSR-linked financing, and green industrial transition under Amrit Kaal Vision 2047.
- GS Paper 2 – Social Justice: CSR-driven empowerment in health, education, and livelihoods, especially in NE and tribal regions.
Basics: What is CSR ?
- Definition: Corporate Social Responsibility (CSR) is the ethical obligation of companies to contribute to societal and environmental well-being.
- Legal Mandate:
- Introduced under Companies Act, 2013 (Section 135).
- Mandates companies with net worth ≥ ₹500 crore, or turnover ≥ ₹1,000 crore, or net profit ≥ ₹5 crore to spend 2% of average net profits (past 3 years) on CSR.
- CSR Areas: Health, education, environment, rural development, gender empowerment, skill development, and poverty alleviation.
India’s CSR Ecosystem
- Global Leadership: India is the first country to legally mandate CSR expenditure.
- CSR as Strategy (Not Charity):
- Earlier: Philanthropy-driven goodwill.
- Now: Strategic integration into business models aligned with SDGs and ESG (Environmental, Social, Governance) norms.
- Regulatory Oversight: Ministry of Corporate Affairs (MCA) monitors through National CSR Data Portal.
CSR Spending Trends (FY 2023–24)
- Total CSR spending: ₹29,987 crore (↑15% YoY).
- PSUs’ share: ₹5,000 crore (↑19%).
- Sectoral Priorities:
- Healthcare: 25%
- Environment & Sustainability: 20%
- Education & Rural Development: 15%
- Skill Development & Livelihoods: 10–15%
- Shift in Focus: From short-term charity to long-term sustainability, climate resilience, and inclusive livelihoods.
PSUs as CSR Catalysts
- PSUs combine economic reach, technical expertise, and public accountability — creating scale and credibility for CSR implementation.
- Their CSR activities directly contribute to national missions like:
- Atmanirbhar Bharat (self-reliance)
- Skill India
- Swachh Bharat
- Jal Jeevan Mission
- Beti Bachao Beti Padhao
- National Hydrogen Mission
Major PSU-led CSR Initiatives (FY 2023–24)
a) Indian Oil Corporation (IOC)
- CSR Expenditure (11 years): ₹3,912.33 crore.
- Focus areas: Rural electrification, renewable energy, women’s empowerment, and health outreach.
b) Oil India Limited (OIL)
- Flagship Projects:
- Project Vasundhara: Biodiversity conservation; reforestation & afforestation in Dibrugarh, Assam (Lakhipathar Range).
- Project KAVACH: Safety, disaster preparedness, and community resilience.
- Mobile Medical Units: Last-mile healthcare delivery in Assam & NE.
c) GAIL (India) Limited
- CSR Spend: ₹175.71 crore.
- Programmes:
- ELITE: Empowerment through Education, Livelihood, and Technology — builds water systems, sanitation, and micro-enterprises.
- Sashakt: Women’s economic empowerment through skill-based training & entrepreneurship ecosystems.
- Focus: Climate action, renewable energy, and education support.
d) Rail Vikas Nigam Limited (RVNL)
- Skill Development Project: ₹300 crore for local youth near project sites — aligned with “Viksit Bharat 2047”.
- Digital Literacy Drives & environmental awareness campaigns in collaboration with state governments.
Thematic Focus of PSU CSR
| Theme | Examples | Developmental Link |
| Health & Nutrition | Mobile clinics, sanitation, maternal health | SDG 3 (Good Health) |
| Education & Skilling | Oil Swabalamban, RVNL Training | SDG 4 (Quality Education), SDG 8 (Decent Work) |
| Environment & Climate | Project Vasundhara, GAIL green projects | SDG 13 (Climate Action), SDG 15 (Life on Land) |
| Gender Inclusion | Sashakt, women-led microenterprises | SDG 5 (Gender Equality) |
| Infrastructure & Connectivity | Electrification, water systems | SDG 9 (Industry, Innovation, Infrastructure) |
Regional Impact
- Backward & Border Regions: CSR focus on North-East, Central India, and tribal belts.
- Urban Development: Support for smart city components, green mobility, and waste management systems.
- Bridging Urban–Rural Divide: Integrated CSR for education, healthcare, and livelihoods across geography.
Policy–Corporate Synergy
- Government’s National Guidelines on Responsible Business Conduct (NGRBC, 2019) align PSUs’ CSR with SDG frameworks.
- Sustainable Finance & ESG Reporting: CSR data increasingly linked to BRSR (Business Responsibility and Sustainability Reporting).
- PSUs support flagship missions:
- Net Zero by 2070
- Amrit Kaal Vision 2047
- Make in India + Green Growth
Challenges
- Inequitable CSR Distribution: Concentration in developed states (Maharashtra, Gujarat, TN) vs. low-spending in NE and hill states.
- Outcome Measurement Issues: Lack of standardized impact evaluation metrics.
- Duplication of Efforts: Limited coordination among PSUs, ministries, and NGOs.
- Short-term Visibility Bias: Some projects remain event-driven, not outcome-oriented.
Way Forward
- Shift to Outcome-Based CSR: Measure long-term social impact, not mere financial outlays.
- Cluster Approach: Collaborative CSR among PSUs in the same geography.
- Integrate CSR with ESG: Build sustainability-linked reporting frameworks.
- Technology Integration: Use AI, GIS, and digital dashboards for real-time monitoring.
- Public–Private–Community Partnerships: Co-design projects with local institutions.
- Focus on Resilient Livelihoods: Green skilling, renewable energy, circular economy.
Conclusion
- PSUs are transforming CSR from compliance to commitment, blending economic strength with social consciousness.
- Their initiatives align with SDGs, Amrit Kaal Vision 2047, and Viksit Bharat goals.
- A sustainable and inclusive future hinges on strengthening CSR–governance convergence, ensuring that growth is both green and equitable.
In u-turn, US gives 6-month sanction relief to Chabahar
In News
- The U.S. reinstated a 6-month sanctions waiver (effective October 29, 2025) for India’s participation in the Chabahar Port Project in Iran.
- This marks a policy reversal from the September 18, 2025 decision to withdraw the waiver, which had briefly subjected Indian operations to American sanctions.
Relevance:
- GS Paper 2 – International Relations: India–Iran–US triangular diplomacy, regional connectivity, and Chabahar Port’s strategic relevance for Afghanistan and Central Asia.
- GS Paper 3 – Economy: Trade logistics, maritime connectivity, and integration with INSTC for Eurasian access.
Background
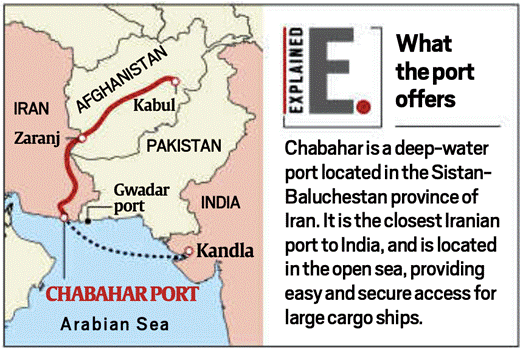
- Chabahar Port: Located in Sistan–Baluchestan Province, Iran, it is the closest Iranian port to India and outside the Persian Gulf, offering direct access to the Indian Ocean.
- Strategic Location: ~170 km west of Pakistan’s Gwadar Port (developed by China under CPEC).
- Historical Engagement:
- 2003–05: Initial Indo-Iran talks for port development.
- 2015: MoU between India and Iran to jointly develop Shahid Beheshti Terminal at Chabahar.
- 2016: India–Iran–Afghanistan Trilateral Agreement on the Chabahar International Transport and Transit Corridor during PM Modi’s Iran visit.
- 2018: U.S. (under Trump) granted sanctions waiver recognizing Chabahar’s importance for Afghanistan’s connectivity and humanitarian supplies.
- Dec 24, 2018: Indian firm India Ports Global Ltd (IPGL) took over port operations.
Recent Timeline
| Date | Development |
| Sep 18, 2025 | U.S. revoked waiver citing Iran-related sanctions (IFCPA Act). |
| Sep 29, 2025 | Sanctions regime took effect, impacting Indian participation. |
| Oct 29, 2025 | U.S. reinstated 6-month waiver, citing humanitarian and regional connectivity grounds. |
India’s Role and Achievements at Chabahar
- Investment: ~$25 million (equipment & cranes).
- Handled: > 90,000 TEUs and 8.4 million metric tons of cargo since 2018.
- Humanitarian Role:
- 2.5 million tons of wheat and 2,000 tons of pulses sent to Afghanistan.
- 40,000 litres of bio-pesticide supplied to Iran (2021).
- Key supply route during COVID-19 pandemic.
Strategic & Economic Significance
Regional Connectivity
- Forms a key link in the International North-South Transport Corridor (INSTC) connecting India–Iran–Afghanistan–Central Asia–Russia.
- Bypasses Pakistan, countering its blockade of Indian access to Afghanistan.
- Provides India with direct sea-land connectivity to Eurasia.
Strategic Balancing
- Counters China’s Gwadar Port under CPEC — maintains India’s strategic presence in the region.
- Strengthens India–Iran cooperation amidst Sino–Pakistani maritime expansion.
Economic Opportunities
- Facilitates Indian exports to Central Asia and Russia through reduced transit costs and time.
- Potential future link with INSTC multimodal network via Bandar Abbas and Caspian Sea.
Geopolitical Leverage
- Demonstrates India’s strategic autonomy — balancing ties with U.S. and Iran simultaneously.
- Acts as a stabilizing channel for humanitarian trade to Afghanistan, aligning with U.S. humanitarian interests despite sanctions.
U.S. Concerns and Policy Dynamics
- Sanctions Legal Basis: Iran Freedom and Counter-Proliferation Act (IFCPA), 2012.
- Waivers are conditional — allowed for non-military, humanitarian, and regional development purposes.
- September withdrawal reflected Washington’s pressure on Tehran amid renewed tensions (nuclear and regional issues).
- October reinstatement indicates:
- Recognition of India’s stabilizing role in Afghanistan.
- Need for regional connectivity to curb Chinese influence.
- Tactical move before the U.S. election cycle to avoid alienating India.
Challenges Ahead
- Short-term waiver (6 months) creates policy uncertainty for long-term planning.
- Sanctions compliance risks for Indian companies and banks.
- Iran’s internal instability and shifting U.S.–Iran relations may disrupt continuity.
- Competition from Gwadar and China’s Belt and Road Initiative remains strong.
Way Forward for India
- Diplomatic Engagement: Continue strategic dialogue with U.S. to secure longer-term exemptions.
- Multilateral Coordination: Integrate Chabahar more deeply into INSTC and SCO connectivity frameworks.
- Operational Expansion: Upgrade infrastructure and enhance throughput capacity beyond the current 8.4 MMT.
- Financial Shielding: Explore rupee–rial trade and sovereign-backed financial mechanisms to bypass sanction exposure.
After ASEAN Summit: Group’s importance for India, amid US-China tussle
Why in News ?
- 47th ASEAN Summit and Related Summits concluded in Kuala Lumpur (2025) under Malaysia’s chairmanship.
- The summit occurred amid rising US–China rivalry and ongoing review of the ASEAN–India FTA (AITIGA).
- India’s engagement with ASEAN gains renewed significance under Act East Policy and Indo-Pacific Vision.
Relevance:
- GS Paper 2 – International Relations: India’s Act East and Indo-Pacific strategy, ASEAN centrality, and balancing amid US–China rivalry.
- GS Paper 3 – Economy: Trade integration, AITIGA review, and supply chain resilience in ASEAN-led frameworks.
Basics: What is ASEAN ?
- Full Form: Association of Southeast Asian Nations.
- Founded: 8 August 1967 (Bangkok Declaration).
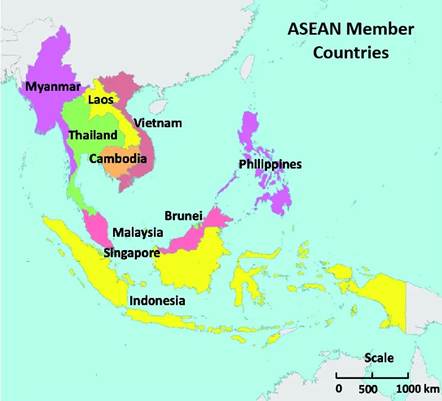
- Members (10): Brunei, Cambodia, Indonesia, Laos, Malaysia, Myanmar, Philippines, Singapore, Thailand, Vietnam.
- Objectives: Promote regional peace, stability, economic growth, and cultural development.
- Secretariat: Jakarta, Indonesia.
ASEAN’s Evolution
- 1967–1976: Political bloc to contain communism.
- 1976–1990s: Regional stability and dialogue mechanisms (Treaty of Amity and Cooperation 1976).
- 2000s onward: Economic integration – ASEAN Free Trade Area (AFTA), ASEAN Economic Community (AEC 2015).
- Present: Second most integrated trade bloc after the EU with 25–30% intra-ASEAN trade.
ASEAN’s Global Role
- Economic Hub: Combined GDP ≈ $3.9 trillion (2024); 5th largest economy globally.
- Demographics: 650+ million population; major manufacturing base and logistics corridor.
- Geostrategic Pivot: Lies at the heart of the Indo-Pacific, central to South China Sea (SCS) security and global supply chains.
US–China Rivalry and ASEAN’s Balancing Act
- Security–Economy Dichotomy:
- US: Traditional security provider (military presence, alliances, AUKUS, Quad).
- China: Largest trading partner for most ASEAN nations.
- Pressure Points:
- South China Sea disputes – esp. with Philippines, Vietnam, Malaysia.
- China’s assertiveness vs. ASEAN’s neutrality principle (“ASEAN centrality”).
- ASEAN’s Strategy: Avoid choosing sides; promote “ASEAN-led” platforms (EAS, ARF, ADMM+).
India–ASEAN Relations: Evolution
- Pre-1990s: Limited engagement due to Cold War alignments.
- 1992: Look East Policy initiated – political & economic outreach.
- 2014: Upgraded to Act East Policy – focus on connectivity, commerce, culture, and capacity-building.
- 2022: 30th Anniversary of Dialogue Relations celebrated as ASEAN–India Friendship Year.
Key Pillars of ASEAN–India Cooperation
a) Connectivity
- India–Myanmar–Thailand Trilateral Highway (IMT): Connects Manipur to Mae Sot (Thailand) via Myanmar.
- Kaladan Multimodal Transit Project: Links Kolkata–Sittwe Port–Mizoram.
- ASEAN–India Connectivity Master Plan 2025: Integrates digital, physical, and people-to-people links.
b) Trade and Investment
- ASEAN–India Trade in Goods Agreement (AITIGA) – signed 2009, review began 2022 (to conclude 2025).
- Trade Volume (2024): ~$131 billion; ASEAN = India’s 4th largest trading partner.
- Challenge: India’s trade deficit >$40 billion with ASEAN (notably with Indonesia, Malaysia, Thailand).
- Reason: Low tariff advantage, Rules of Origin misuse, non-tariff barriers.
c) Strategic & Security Cooperation
- Defence dialogues: ADMM-Plus, East Asia Summit, Indian Navy exercises with Singapore, Vietnam, Indonesia, Philippines.
- Maritime Security: Cooperation on freedom of navigation, anti-piracy, and SCS norms.
- Counterterrorism & Cybersecurity: ASEAN-India Centre, ASEAN Regional Forum collaboration.
d) Cultural & Civilizational Links
- Shared Buddhist heritage, linguistic ties, and diaspora networks.
- Initiatives like ASEAN–India Network of Think Tanks and Scholarship Programs deepen soft power ties.
India’s Strategic Stakes in ASEAN
- Economic Diversification: Reduces overdependence on China.
- Indo-Pacific Strategy: Ensures open, inclusive maritime commons.
- North-East Integration: Enhances regional development and connectivity.
- Geoeconomic Leverage: Platforms like BIMSTEC, BBIN, IORA complement ASEAN linkages.
- Supply Chain Resilience: Alternative to China-led networks (aligns with Indo-Pacific Economic Framework – IPEF).
Comparison: ASEAN vs Other Regional Blocs
| Group | Members | Nature | India’s Engagement |
| ASEAN | 10 SE Asian states | Economic & security integration | Sectoral & strategic partner |
| SAARC | 8 South Asian states | Political, stagnant due to India–Pakistan issues | Non-functional |
| BIMSTEC | 7 Bay of Bengal states | Compact, functional | Key focus post-SAARC |
| BBIN | 4 (Bangladesh, Bhutan, India, Nepal) | Connectivity & trade | Sub-regional cooperation |
| CPTPP | 11 Pacific economies | High-standard FTA | Potential future option for India |
Lessons from ASEAN for India
- Consensus-based gradualism works – incremental trust-building over decades.
- Economic integration precedes political unity – unlike SAARC’s security-first failure.
- Institutional continuity and centrality sustain credibility.
- Compact regional frameworks (BIMSTEC/BBIN) may yield faster results than large blocs.
- Balance of power diplomacy – ASEAN’s neutrality offers model amid US–China competition.
Way Forward for India
- Complete AITIGA Review to correct trade asymmetry.
- Deepen Supply Chain Integration via digital trade, logistics, and fintech cooperation.
- Strengthen Defence Ties through joint maritime patrols and technology transfers.
- Accelerate Connectivity Projects in NE region with timelines.
- Pursue Multi-Alignment: Engage ASEAN-led forums while maintaining strategic autonomy.
- Explore CPTPP Accession after domestic readiness.
- Champion ASEAN Centrality within the Indo-Pacific architecture.
Conclusion
- ASEAN remains pivotal for India’s Act East and Indo-Pacific vision.
- Amid US–China contestation, ASEAN is both arena and actor shaping Asian geopolitics.
- For India, sustained engagement with ASEAN through economic pragmatism, strategic partnerships, and connectivity will be crucial to emerge as a regional leader in a multipolar Asia.
Land beneath India’s five largest cities is sinking due to over-extraction of groundwater: Study
Why in News ?
- A new Nature Sustainability (2025) study revealed that India’s five megacities — Delhi, Mumbai, Kolkata, Bengaluru, and Chennai — are sinking due to excessive groundwater extraction.
- The study used satellite radar data (2015–2023) to map urban land subsidence, impacting over 13 million buildings and 80 million residents.
Relevance
- GS 1: Urbanisation, geomorphological processes (subsidence).
- GS 3: Environmental degradation, water resource management, disaster risk reduction.
- GS 2: Governance — institutional response through CGWA, Jal Shakti Mission, and Smart Cities.
Key Findings
- Total subsiding area: 878 sq. km of urban land.
- Population exposed: 1.9 million people at >4 mm/year subsidence rate.
- Max subsidence rates:
- Delhi – 51.0 mm/yr
- Chennai – 31.7 mm/yr
- Mumbai – 26.1 mm/yr
- Kolkata – 16.4 mm/yr
- Bengaluru – 6.7 mm/yr
City-wise Analysis
Delhi (NCT)
- Hotspots: Bijwasan, Faridabad, Ghaziabad.
- Cause: Compaction of alluvial deposits due to unregulated groundwater withdrawal.
- Local uplift: Detected near Dwarka (+15.1 mm/yr) due to rainwater harvesting and aquifer recharge policies post-2011.
Chennai
- Hotspots: Adyar floodplains (K K Nagar, Tondiarpet, Valasaravakkam, Kodambakkam).
- Cause: Compaction of Holocene alluvium (sandy clay, silt, sand) and intensive groundwater extraction.
- Impact: Highest projected structural risk among cities by 2075.
Mumbai
- Subsidence low overall, except in high-density informal settlements (e.g., Dharavi).
- Cause: Uneven land compaction due to localized extraction and structural load.
Kolkata
- Cause: Compaction of Pleistocene–Holocene sediments; subsidence along riverine and deltaic areas.
- Risk: Increasing vulnerability due to soft sediment structure.
Bengaluru
- Lowest subsidence due to igneous and metamorphic rock base (gneiss, granite).
- Warning: Recent surge in groundwater extraction (2022–2023) may increase risk.
Structural Risk Projections
| Year | Delhi | Chennai | Mumbai | Bengaluru | Kolkata | Total (very high risk buildings) |
| 2025 | 2,264 | 32 | 110 | — | — | — |
| 2055 | 3,169 | 958 | 255 | — | — | — |
| 2075 | 11,457 | 8,284 | 3,477 | 112 | 199 | 23,529 |
Underlying Causes
- Over-extraction of groundwater via millions of unregulated borewells.
- Urban load stress from vertical construction increasing soil compaction.
- Lack of recharge infrastructure and inefficient stormwater management.
- Climate variability: Declining rainfall recharge and increasing urban heat.
Broader Implications
- Infrastructure risk: Cracking foundations, damaged pipelines, and transport networks.
- Hydrological risk: Land sinking worsens flooding, especially during monsoons.
- Seismic risk: Uneven compaction increases earthquake vulnerability.
- Economic cost: Rising insurance risk and maintenance expenditure in megacities.
Positive Example
- Dwarka (Delhi):
- Local uplift due to aquifer recharge and rainwater harvesting between 2012–2015.
- Demonstrates success of policy-driven groundwater restoration.
Way Forward – Mitigation & Adaptation
- Regulatory measures:
- Enforce groundwater extraction caps under CGWA guidelines.
- Mandate recharge pits and rainwater harvesting for large buildings.
- Urban hydrology reform:
- Integrate surface water management with stormwater networks.
- Develop artificial recharge zones near floodplains.
- Nature-based solutions:
- Promote re-vegetation and soil conservation to stabilise land.
- Monitoring & Technology:
- Expand InSAR satellite surveillance for urban subsidence tracking.
- Public awareness:
- Integrate groundwater literacy in urban planning and civic education.