Content
- India’s First Bat Conservation Assessment: Data Deficit & Emerging Threats
- Ocean Warming and Double Jeopardy for Sharks and Tunas
- Delimitation Amendment Defeat: Equality vs Federal Balance
- West Bengal Fisheries: High Production, Slower Growth
- India Slips to Sixth Largest Economy: Currency and Base Effects
- Women’s Representation in Legislatures: Persistent Deficit
First-ever bat conservation assessment flags threat to species, data dark spots
Context: Why in News?
- India’s first-ever national bat conservation assessment (2024–25) highlights threats, data gaps, and ecological importance of bats, based on inputs from 36 experts across 27 institutions.
- The report flags “data dark spots”, rising threats from urbanisation, land-use change, and climate impacts, and calls for urgent research and conservation action.
Relevance
GS III (Environment & Biodiversity)
- Species Conservation
- ~135 species; 16 endemic, 7 threatened, ~35 data deficient → conservation gap
- Ecosystem Services
- Pollination, seed dispersal, pest control → agriculture–biodiversity linkage
- Data Deficiency
- “Data dark spots” → policy blind spots in Himalayas, NE, islands
- Human–Wildlife Interface
- Roosting in monuments/buildings → urban ecology + heritage conflict
GS III (Science & Tech / Health)
- One Health Approach
- Zoonotic spillover concerns vs ecological role → integrated surveillance need
Practice Questions
- “Data deficiency is a major challenge in biodiversity conservation in India.” Examine with reference to bat conservation.(250 Words)
Static Background: Bats in Ecology
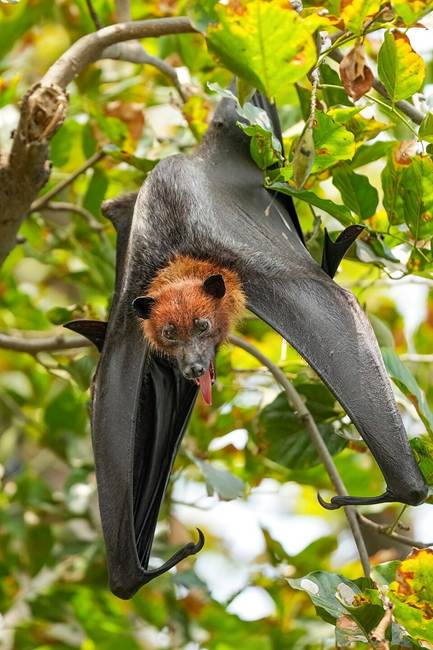
- Bats are the only flying mammals, with around ~135 species recorded in India.
- They play critical ecosystem roles:
- Pollination of plants
- Seed dispersal aiding forest regeneration
- Pest control, reducing agricultural losses
- Contribution to soil nutrients through guano (droppings)
- Despite ecological importance, bats face negative perception due to zoonotic disease associations, especially post-COVID-19.
- The “Flying Fox” Status: The Indian Flying Fox (Pteropus giganteus) has been moved from ‘Least Concern’ to ‘Near Threatened’ in recent local observations due to roost tree felling.
Conservation Status: Data Deficit & Threats
- Out of ~135 species in India:
- 16 species are endemic (found only in India)
- 7 species listed as “Threatened” by International Union for Conservation of Nature
- ~35 species are data deficient or unassessed, indicating major knowledge gaps
- Key threats include:
- Urbanisation and habitat loss
- Deforestation and mining activities
- Land-use changes and climate variability
- Persecution due to stigma as disease carriers
“Data Dark Spots”: Uneven Research Distribution
- Research on bats is geographically skewed, leading to incomplete understanding:
- Well-studied regions: Western Ghats and southern India
- Understudied regions: Himalayas, Northeast India, Andaman & Nicobar Islands
- Under-sampled areas: Eastern Ghats and Terai lowlands
- This uneven distribution creates “data dark spots”, affecting effective conservation planning.
Habitat Patterns: Natural & Anthropogenic
- Bats roost in both natural habitats and human-made structures:
- Natural: Caves and trees (stable microclimate, predator protection)
- Man-made: Buildings, monuments, wooden structures
- Example:
- Large colonies found in protected monuments in Delhi, Hyderabad, Maharashtra
- Issue:
- Potential conflict with tourism and heritage conservation, including structural damage
- Suggested approach:
- Collaboration with Archaeological Survey of India for eco-tourism and conservation integration
Biodiversity Distribution
- West Bengal has highest bat diversity (68 species)
- Followed by:
- Meghalaya: 66 species
- Uttarakhand: 52 species
- Sikkim: 43 species
- Urban example:
- Delhi: ~15 species despite urban pressures
- Low diversity regions:
- Punjab & Haryana: ~5 species (limited forest cover)
Ecological vs Public Health Debate
- Ecosystem Services:
- Bats support agriculture, biodiversity, and ecosystem stability
- Public Health Concern:
- Potential role in zoonotic spillovers.
- Spillover likely directly from bats or via intermediate hosts
- Balanced approach required:
- Surveillance of pathogens, not indiscriminate culling
Key Recommendations of the Report
- Increase research funding and permits for bat ecology studies
- Expand pathogen surveillance, especially in Northeast and Western Ghats
- Conduct studies on:
- Diet, habitat use, and ecological roles
- Impact of pollution and climate change
- Promote multi-agency collaboration beyond Forest Departments
- Improve public awareness to reduce stigma
Analytical Overview
- Highlights classic issue of “data deficiency in biodiversity conservation”, affecting policy design
- Demonstrates tension between:
- Ecological importance of species
- Public perception and health concerns
- Reflects need for integrated approach (environment + public health + urban planning)
Prelims Pointers
- Total bat species in India: ~135
- Endemic species: 16
- Threatened species (IUCN): 7
- Data deficient/unassessed: ~35 species
- Top diversity state: West Bengal (68 species)
- Key habitats: Caves, trees, monuments, buildings
Great White Shark, tunas face ‘double jeopardy’ as oceans warm, warns study
Context: Why in News?
- A study published in Science journal (April 2026) highlights that mesothermic (warm-bodied) fish like Great White sharks and tunas face “double jeopardy” due to ocean warming.
- The research shows that rising ocean temperatures are shrinking suitable habitats while simultaneously increasing energy demands, creating a dual stress on these species.
Relevance
GS III (Environment & Climate Change)
- Climate Change Impact
- Ocean warming → habitat shrinkage + poleward migration
- Marine Ecology
- Apex predators (sharks, tuna) → trophic cascade risks
- Physiological Limits
- Heat-balance threshold (~17°C for large sharks) → species vulnerability metric
Practice Questions
- “Climate change is altering marine ecosystems through physiological and ecological pathways.” Discuss with examples.(250 Words)
Static Background: Marine Physiology Concepts
- Most fish are ectothermic (cold-blooded), meaning their body temperature matches surrounding water.
- A rare group (<0.1% of fish species) are mesothermic, including:
- Great White Shark
- Basking Shark
- Bluefin Tuna
- These species can retain metabolic heat, enabling:
- Faster swimming
- Long-distance migration
- Enhanced predatory efficiency
- However, this comes at a high metabolic cost, requiring significantly more energy intake.
Core Scientific Findings
- Mesothermic fish use about ~3.8 times more energy than similarly sized cold-blooded fish.
- A 10°C increase in body temperature more than doubles metabolic rate, sharply increasing food requirements.
- Large individuals (e.g., 1-tonne sharks) face heat-balance limits above ~17°C, beyond which they struggle to regulate body temperature.
- Data derived using biologging sensors measuring real-time body temperature and environmental conditions.
The “Double Jeopardy” Explained
A. Thermal Stress (Physical Constraint)
- As ocean temperatures rise, heat loss becomes inefficient, especially for large-bodied fish due to surface-area-to-volume mismatch.
- Leads to overheating risk, forcing behavioural changes such as:
- Slowing down metabolic activity
- Altering blood flow
- Diving into deeper, cooler waters
B. Ecological Mismatch (Biological Constraint)
- Movement to cooler waters results in reduced prey availability, as prey species may not migrate similarly.
- Reduced hunting efficiency due to loss of speed and power advantage, critical for apex predators.
- Creates a mismatch between energy demand and food supply, threatening survival.
Ecological Implications
- Habitat Shrinkage: Suitable thermal zones for large mesotherms expected to decline significantly, especially in summer months.
- Poleward Migration: Species may shift towards higher latitudes, altering marine biodiversity patterns.
- Trophic Cascade Risks: As apex predators decline or relocate, marine food webs may destabilise.
- Overfishing Interaction: Existing pressure from overfishing of both predators and prey compounds vulnerability.
Analytical Overview
- Mesothermic fish act as indicator species of ocean health, and their stress signals broader ecosystem disruption.
- The issue reflects interaction of:
- Climate change (warming oceans)
- Biological limits (metabolism, thermoregulation)
- Human pressures (overfishing)
- Introduces concept of “heat-balance threshold”, a useful metric for predicting species vulnerability under warming scenarios.
Key Takeaways
- Highlights emerging theme of climate change impacts on marine megafauna, relevant for GS-3 (Environment & Ecology).
- Demonstrates how physiological traits can become liabilities under changing environmental conditions.
- Reinforces need for ecosystem-based fisheries management and climate adaptation strategies.
Prelims Pointers
- Mesothermic Fish: Rare (<0.1% species), capable of retaining metabolic heat.
- Energy Use: ~3.8 times higher than ectothermic fish.
- Heat Threshold: Large sharks struggle above ~17°C water temperature.
- Technology Used: Biologging sensors for real-time ecological data.
- Key Impact: Poleward migration and habitat shrinkage due to ocean warming.
Constitution Amendment Bill, part of delimitation package, defeated
Context: Why in News?
- The Constitution (131st Amendment) Bill, 2026 was defeated in Lok Sabha (April 17, 2026), preventing immediate implementation of delimitation-linked reforms and women’s reservation timeline.
- Voting Outcome: 298 in favour, 230 against; 528 present & voting, falling short of 352 votes (2/3rd requirement) under Article 368.
- Following the defeat, the government withdrew allied legislations — Delimitation Bill, 2026 and Union Territories Laws (Amendment) Bill, 2026.
- The issue triggered debate on representation, federal balance, and legislative procedure.
Relevance
GS II (Polity & Governance)
- Constitutional Safeguards
- Article 368 → special majority ensures consensus
- Electoral Reforms
- Delimitation → equal representation vs political feasibility
- Federalism Debate
- Population-based seats → North–South imbalance concerns
- Legislative Process
- Defeat → parliamentary accountability & opposition role
Practice Questions
- “Delimitation raises a fundamental tension between democratic equality and federal balance.” Analyse.(250 Words)
Static Background: Constitutional & Delimitation Framework
- Constitutional Amendment (Article 368): Requires
- Majority of total membership, and
- 2/3rd of members present and voting (special majority).
- Delimitation: Process of redrawing constituency boundaries based on population to ensure electoral equality.
- Conducted by Delimitation Commission of India, whose decisions are final and legally binding.
- 84th Amendment (2001): Froze seat redistribution till first Census after 2026, balancing population control incentives and representation equity.
What Did the Bill Propose?
- Delimitation based on 2011 Census, instead of waiting for post-2026 Census data.
- Expansion of Lok Sabha seats (~850 seats) to reflect population changes.
- Time-bound implementation of Women’s Reservation (33%) by linking it with delimitation.
- Objective cited: Upholding “one person, one vote, one value” principle.
Core Controversy: Delimitation Linkage
- The Bill combined three major reforms:
- Women’s Reservation implementation
- Delimitation exercise
- Lok Sabha expansion
- Concerns raised that using 2011 population data could:
- Increase representation of high-growth northern states
- Reduce relative share of southern, eastern, and northeastern states
- This raised issues of regional equity and federal balance, beyond mere electoral arithmetic.
Legislative & Procedural Issues
- Special Majority Not Achieved: Despite majority support, the Bill failed due to strict constitutional threshold, highlighting importance of broad consensus.
- Timing Concern: Proposal based on 2011 Census, while 2026–27 Census is ongoing, raised questions about data relevance.
- Bundling of Issues: Linking women’s reservation with delimitation was seen as complicating an otherwise consensus-based reform.
“Verbal Assurance vs Legislative Text” Issue
- During debate, the government offered to include a uniform 50% increase in seats for all states to address concerns over regional imbalance.While it solves the “loss of seats” for the South, it doesn’t solve the “dilution of value” for southern voters, which is the core federalism challenge.
- However, this provision was not part of the original Bill text, leading to questions on legislative clarity and drafting intent.
- The Opposition expressed reservations about accepting last-minute changes without formal incorporation into the Bill.
Political Positions
- Government’s Position:
- Aimed to ensure time-bound implementation of women’s reservation (targeting 2029 elections)
- Emphasised principle of equal representation based on population
- Opposition’s Position:
- Raised concerns over federal imbalance and timing of delimitation
- Objected to linking reservation with delimitation, advocating separate consideration
- Reflects a broader debate between efficiency of reform vs need for consensus and federal accommodation.
Consequences of the Defeat
- Immediate Impact:
- Withdrawal of Delimitation Bill and UT Amendment Bill
- Women’s Reservation:
- Remains dependent on future delimitation exercise, hence implementation timeline uncertain
- Policy Direction:
- Likely shift towards post-2026 Census delimitation and committee-based consultations
Key Analytical Takeaways
- Demonstrates effectiveness of constitutional safeguards (special majority) in ensuring broad-based agreement for structural changes.
- Highlights tension between:
- Democratic principle (population-based representation)
- Federal principle (balanced regional representation)
- Shows importance of legislative clarity, sequencing of reforms, and institutional consensus-building.
Prelims Pointers
- Article 368: Constitutional amendment requires special majority (total membership + 2/3rd present & voting).
- 84th Amendment (2001): Froze delimitation till post-2026 Census.
- Lok Sabha Strength: Currently 543 seats, proposed expansion to ~850 seats.
- Delimitation Commission: Independent body; orders are non-justiciable.
- Women’s Reservation Act (2023): Implementation contingent on delimitation after Census.
- Census Link: Delimitation must follow latest Census data, making 2026–27 Census crucial trigger.
West Bengal in Fish Production
Context: Why in News?
- Fish production has emerged as a political issue in West Bengal, with debates around self-sufficiency and inter-state supply restrictions.
- Data from the Union Ministry of Fisheries shows that West Bengal remains the 2nd largest fish producer (2024–25), despite criticisms regarding stagnation.
- Raises questions on growth trends, sectoral composition, and regional competition in fisheries.
Relevance
GS III (Economy – Agriculture & Fisheries)
- Blue Economy
- Fisheries → nutrition, employment, exports
- Regional Competitiveness
- Bengal (2nd) vs Andhra (1st) → growth divergence (~46% vs ~179%)
- Sectoral Imbalance
- Inland dominance (~20.07 LT) vs marine lag (~3.67 LT)
Practice Questions
- “India’s fisheries sector is witnessing a shift from coastal to inland dominance.” Examine.(250 Words)
Static Background: Fisheries in India
- Fisheries is a key component of agriculture and allied sectors, contributing to nutrition security, employment, and exports.
- India is the 2nd largest fish-producing countries globally, with production driven by:
- Inland fisheries (ponds, rivers, aquaculture)
- Marine fisheries (coastal and deep-sea fishing)
- Policy push through schemes like Pradhan Mantri Matsya Sampada Yojana (PMMSY) and Blue Revolution (Neel Kranti).
Production Trends: Rank vs Growth Dynamics
- West Bengal has consistently maintained 2nd rank in total fish production from 2014–15 to 2024–25, indicating stability in output levels.
- Production increased from 16.17 lakh tonnes (2014–15) to 23.74 lakh tonnes (2024–25), an absolute rise of 7.57 lakh tonnes.
- However, growth rate (~46.8%) is relatively moderate compared to:
- Andhra Pradesh: ~179% growth
- Uttar Pradesh: ~169% growth
- Suggests that while Bengal’s production base is strong, relative growth momentum is slower compared to emerging competitors.
Sectoral Composition: Inland vs Marine Imbalance
- West Bengal’s fisheries sector is predominantly inland-focused, with:
- Inland production: ~20.07 lakh tonnes (Rank 2)
- Marine production: ~3.67 lakh tonnes (Rank 7)
- Despite having a long coastline and deltaic ecosystem (Sundarbans), marine production remains relatively limited.
- In contrast:
- Gujarat leads marine production (~7.64 lakh tonnes)
- Andhra Pradesh dominates inland fisheries (~88% of its output)
- Indicates a structural imbalance in Bengal’s fisheries sector, with reliance on freshwater aquaculture.
Inter-State Competition: Changing Dynamics
- Andhra Pradesh remains the largest producer (55.39 lakh tonnes), driven by intensive aquaculture and commercial shrimp farming.
- Uttar Pradesh has emerged as a major player (13.31 lakh tonnes), reflecting growth in inland aquaculture despite being landlocked.
- States like Madhya Pradesh (308% growth) and Jharkhand (~242%) show rapid expansion from low bases.
- Trend indicates rise of inland aquaculture across non-coastal states, reducing traditional dominance of coastal regions.
Analytical Overview: Production vs Consumption
- West Bengal is often described as a “fish-deficit state despite high production”, due to:
- Very high per capita fish consumption, among the highest in India
- As a result, the state continues to import fish (carps, hilsa) from Andhra Pradesh and Bangladesh to meet demand.
- This highlights a distinction between:
- Production sufficiency (high output)
- Consumption-driven demand (even higher)
Structural Observations
- Bengal’s fisheries sector is characterised by:
- Small-scale, decentralised pond-based aquaculture systems
- Limited adoption of large-scale commercial aquaculture models seen in Andhra Pradesh
- Competing states are increasingly adopting:
- Technology-driven aquaculture
- Better feed, seed, and supply chain systems
- This creates a divergence between traditional production models and modern intensive systems.
Key Takeaways
- West Bengal demonstrates high production stability but relatively slower growth compared to emerging states.
- Indian fisheries sector is witnessing a shift from coastal dominance to inland aquaculture expansion.
- The debate reflects broader themes of agricultural diversification, regional competitiveness, and food security.
- Fisheries sector remains critical for Blue Economy, rural livelihoods, and export earnings.
Prelims Pointers
- Top Producer (2024–25): Andhra Pradesh (~55.39 lakh tonnes).
- West Bengal: 2nd largest producer (~23.74 lakh tonnes).
- Marine Leader: Gujarat (~7.64 lakh tonnes).
- Highest Growth (Percentage): Madhya Pradesh (~308%).
- Scheme: PM Matsya Sampada Yojana (PMMSY) for fisheries sector development.
- Sector Composition: Inland fisheries dominate India’s total fish production.
How India’s economy slipped to sixth largest, behind Japan, UK
Context: Why in News?
- According to the World Economic Outlook April 2026, India is projected to be the 6th largest economy in 2026, slipping from earlier expectations of becoming 4th largest.
- GDP (Nominal, 2026):
- India: ~$4.15 trillion
- UK: ~$4.27 trillion
- Japan: ~$4.38 trillion
- This shift follows earlier claims (2025) that India had overtaken Japan, highlighting volatility in global GDP rankings.
Relevance
GS III (Economy)
- Macroeconomic Indicators
- Nominal GDP (~$4.15T) vs PPP (~3rd globally)
- Exchange Rate Dynamics
- Rupee depreciation (~10–11%) → ranking impact without growth decline
- Statistical Reforms
- Base year revision (2022–23) → data accuracy vs perception shift
GS II (Governance – Data Credibility)
- Importance of transparent statistical systems
Practice Questions
- “Nominal GDP rankings are not a true reflection of economic strength.” Discuss.(250Words)
Static Background: GDP & Ranking Basics
- GDP (Gross Domestic Product): Total value of goods and services produced within a country in a given period.
- Nominal GDP (USD-based): Used for global rankings, depends on:
- Domestic output (in local currency)
- Exchange rate with US Dollar
- Real GDP: Adjusted for inflation, reflects actual growth performance.
- PPP (Purchasing Power Parity): Adjusts for price differences; India remains 3rd largest globally (~$18–19 trillion) under this measure.
Why Did India Slip? (The “Double Effect”)
A. Statistical Revision (Base Year Change)
- India revised GDP base year to 2022–23 (from 2011–12) in Feb 2026.
- Result: Earlier GDP estimates were slightly overstated.
- Revision Impact:
- GDP reduced from ₹357 trillion → ₹345 trillion (~3–4% downward adjustment).
- Effect: Lower starting base reduced India’s global dollar valuation.
B. Currency Effect (Exchange Rate Dynamics)
- Global rankings use USD conversion, making exchange rate crucial.
- Rupee Depreciation: ~10–11% fall against USD in FY26 reduced India’s GDP in dollar terms.
- Currency Divergence:
- Japanese Yen appreciated (~10%)
- British Pound appreciated (~2%)
- Result:
- India’s GDP deflated in USD terms
- UK & Japan GDPs inflated, widening the gap
Global Ranking Snapshot (2026, Nominal GDP)
- 1st: USA → ~$32.38 trillion
- 2nd: China → ~$20.85 trillion
- 3rd: Germany → ~$5.45 trillion
- 4th: Japan → ~$4.38 trillion
- 5th: UK → ~$4.27 trillion
- 6th: India → ~$4.15 trillion
- Ranks 3–6are tightly clustered (~$4–5 trillion range), making them highly sensitive to exchange rate fluctuations.
Rank vs Growth
- India remains among the fastest-growing major economies (~6.4–6.5%), indicating strong domestic momentum.
- However, nominal GDP rankings reflect valuation, not real economic strength.
- This creates divergence:
- High growth domestically
- Lower global rank due to currency/statistical factors
Recovery Outlook (IMF Projections)
- 2027: India expected to regain 4th position (~$4.5+ trillion) as temporary effects stabilise.
- 2029: Likely to reach $5 trillion economy milestone.
- 2031: Projected to become 3rd largest economy, overtaking Germany.
- Interpretation: Current slip seen as short-term statistical adjustment, not structural slowdown.
Key Economic Concepts
- Nominal vs Real GDP: Rankings use nominal GDP, but welfare depends on real GDP growth.
- Exchange Rate Effect: Currency depreciation can reduce global economic standing without affecting domestic output.
- Base Year Revision: Periodic revision improves accuracy but can cause level shifts in GDP estimates.
- PPP vs Nominal Ranking:
- PPP → real purchasing power (India 3rd)
- Nominal → global economic size (India 6th)
Prelims Pointers
- IMF World Economic Outlook: Published biannually (April & October).
- India GDP (2026): ~$4.15 trillion (Nominal).
- PPP Ranking: India is 3rd largest economy globally.
- Base Year Revision: Changed to 2022–23 in 2026.
- Key Driver of Ranking Change: Exchange rate fluctuations + GDP revision, not decline in growth rate.
- Top Economies: USA, China, Germany remain top 3 in nominal GDP rankings.
Women’s share in Houses rarely crosses half of 33%
Context: Why in News?
- Recent data analysis highlights that women’s representation in Lok Sabha and State Assemblies continues to remain below 15%, despite sustained debates on implementing 33% reservation in legislatures.
- The issue has gained prominence after the failure of Constitution (131st Amendment) Bill, 2026, which has delayed the operationalisation of Women’s Reservation due to its linkage with delimitation.
- The situation underscores a broader concern regarding the gap between increasing political participation of women and their relatively low presence in law-making bodies.
Relevance
GS II (Polity & Governance)
- Democratic Inclusion
- LS ~13.8%, States ~9% → representation deficit
- Electoral Reforms
- Women’s Reservation Act → implementation gap due to delimitation linkage
- Party System
- Candidate selection → key institutional bottleneck
GS I (Society)
- Gender Inequality
- Participation vs representation gap
- Social Norms
- Patriarchy, resource constraints, safety issues
Practice Questions
- “Women’s political participation in India has not translated into proportional representation.” Analyse.(250Words)
Static Background: Representation Framework
- Women’s representation in legislatures is a key component of inclusive democracy and political equality, ensuring diverse perspectives in policy-making.
- The Women’s Reservation Act, 2023 (Nari Shakti Vandan Adhiniyam) provides for 33% reservation in Lok Sabha and State Assemblies, but its implementation is contingent upon post-delimitation exercise after Census.
- India has prior experience with gender quotas through the 73rd and 74th Constitutional Amendments, which mandate at least 33% reservation (extended to 50% in many states) in Panchayati Raj Institutions, demonstrating positive outcomes in grassroots governance.
Parliamentary Trends: Gradual but Limited Progress
- In the Lok Sabha, women’s representation has increased gradually from 4.9% (24 out of 489 seats in 1952) to about 13.8% (75 out of 543 seats in 2024), indicating steady but slow progress over seven decades.
- The highest representation recorded so far was 14.4% in 2019, suggesting that the share has not yet crossed even half of the proposed 33% benchmark.
- It took nearly 15 general elections to reach double-digit representation (10.9% in 2009), reflecting the slow pace of change under the existing system.
- In the Rajya Sabha, women currently constitute around 16% (39 out of 245 members), which is slightly higher but still below global averages.
State Legislatures: Persistent Underrepresentation
- Across State Assemblies, the average representation of women is approximately 9%, indicating a more pronounced gap compared to Parliament.
- Chhattisgarh stands out as an exception, with about 21.1% women MLAs (2023), while most states remain below the 15% threshold.
- Several large states such as Karnataka (4.5%), Assam (5.5%), and Tamil Nadu (7.3%) have particularly low representation, reflecting uneven regional progress.
- In some regions, representation has historically been minimal, as seen in Nagaland, where women were elected to the Assembly for the first time only in 2023, indicating deep-rooted structural barriers.
Party-Wise Trends: Role of Candidate Selection
- Analysis of party-wise representation suggests that political parties play a crucial role in shaping outcomes through candidate selection processes.
- The All India Trinamool Congress has a relatively higher proportion of women MPs (~39.3%), indicating that internal party decisions can significantly influence representation levels.
- In comparison, major national parties such as the Bharatiya Janata Party (~12.9%) and the Indian National Congress (~14.3%) have lower shares, suggesting that voluntary measures alone have had limited impact so far.
- These trends indicate that institutional incentives or mandates may be required to ensure more balanced representation.
Global Comparison: India in Perspective
- According to data from the Inter-Parliamentary Union, India ranks around 147th globally in terms of women’s representation in Lower Houses (2026).
- The global average stands at approximately 27.2% (2025), which is significantly higher than India’s current levels.
- Several countries such as Rwanda, Mexico, and UAE have achieved near or above 50% representation, often supported by well-designed quota systems and electoral reforms.
- Evidence indicates that countries with gender quotas tend to have higher representation (~31%) compared to those without (~17%), highlighting the role of institutional mechanisms.
Structural Factors Influencing Representation
- Women’s underrepresentation is influenced by a combination of institutional, socio-economic, and cultural factors rather than a single cause.
- Political participation is shaped by access to financial resources, organisational support, and social networks, areas where women often face constraints.
- Societal norms, safety concerns, and domestic responsibilities can further limit entry into competitive electoral politics.
- Over time, these factors create a self-reinforcing cycle, where low representation leads to fewer opportunities and role models for future participation.
Broad Analytical Takeaways
- The data suggests that while women’s electoral participation has increased significantly, representation in legislatures has not kept pace, indicating a structural gap in democratic inclusion.
- Experience from local governance shows that institutional interventions such as reservation can accelerate representation, though their design and implementation require careful consideration.
- The ongoing debate reflects a balance between voluntary political reforms and legislative mandates, with different stakeholders emphasising different approaches.
- The issue remains central to discussions on democratic deepening, gender equality, and institutional reform in India.
Prelims Pointers
- Lok Sabha (2024): Women MPs = 75/543 (~13.8%), highest ever ~14.4% (2019).
- Rajya Sabha: Women constitute about 16% of total membership.
- State Assemblies: Average representation ~9%, with Chhattisgarh (~21%) being an exception.
- Global Rank: India placed around 147th (IPU, 2026) in women’s representation.
- Quota Impact: Countries with quotas show ~31% representation vs ~17% without quotas.
- Nagaland Milestone: First women MLAs elected in 2023, indicating late entry in some regions.


