Contents
- Taliban, opposition battle for Panjshir
- Account Aggregator (AA) platform goes live
- Climate Change and its impact on El Nino and La Nina
- IUCN assessment on species facing extinction
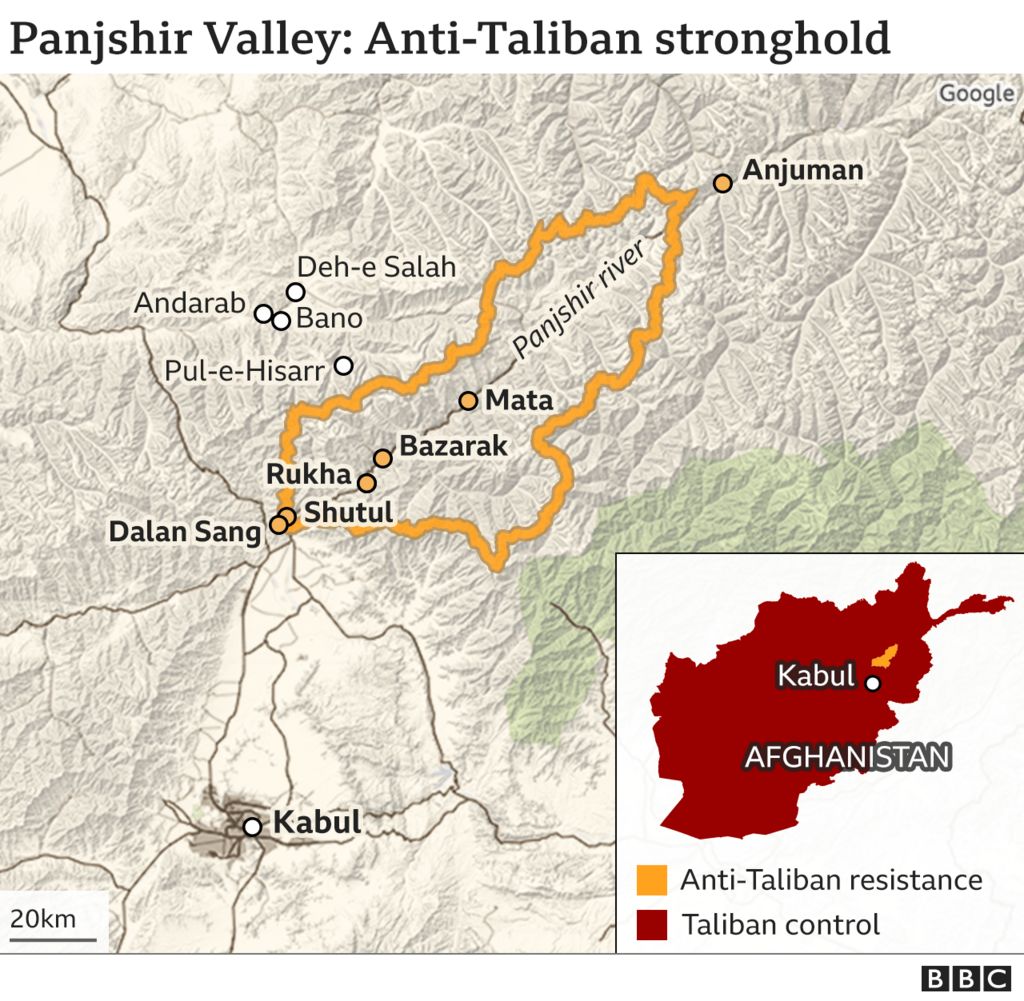
Taliban, opposition battle for Panjshir
Context:
- Fresh fighting was reported between the Taliban and resistance forces in Afghanistan’s Panjshir Valley, as the hardline Islamists are in the process of finalising a government that will set the tone for their rule.
- Taliban sources said that its fighters had taken the Valley, although the resistance denied it had fallen.
Relevance:
Prelims, GS-I: Geography (Maps), GS-II: International Relations
Dimensions of the Article:
- About Panjshir Valley
- Importance of Panjshir valley
About Panjshir Valley
- The Panjshir Valley is a valley in north-central Afghanistan, 150 kilometres north of Kabul, near the Hindu Kush mountain range.
- It’s divided by the Panjshir river and ringed by the Panjshir mountains in the north and the Kuhestan mountains in the south.
- The valley is home to more than 100,000 people, including Afghanistan’s largest concentration of ethnic Tajiks.
- The mountain tops are covered by snow throughout the year and this difficult terrain makes the Valley a nightmare for invaders.
Importance of Panjshir valley
- The Valley has repeatedly played a decisive role in Afghanistan’s military history, as its geographical position almost completely closes it off from the rest of the country.
- The only access point to the region is through a narrow passage created by the Panjshir River, which can be easily defended militarily.
- Famed for its natural defenses, the region tucked into the Hindu Kush mountains never fell to the Taliban during the civil war of the 1990s, nor was it conquered by the Soviets a decade earlier.
- Panjshir Valley was among the safest regions in the country during the time of the NATO-backed government from 2001 to 2021.
- The Panjshir Valley has the potential to become a major centre of emerald mining. Even during the medieval period, it was famous for silver mining.
Why hasn’t it fallen to the Taliban yet?
- The Taliban have not been able to capture Panjshir because of the location of the valley, which makes it a natural fortress.
- Its crucial location, being north of Kabul in the Hindu Kush, gives it a geographical advantage.
- This was a resistance stronghold against the Soviets in the 1980s and then against the Taliban in the 1990s.
- Since it has always remained the resistance zone, it was never conquered by any forces – neither by foreign forces nor by the Taliban.
What are the challenges for Pansjhir?
- The main challenge that lies ahead for Panjshir is the Taliban putting up guards around it in order to stop its food and essentials supply.
- However, as per an official report, the valley has enough food and medical supplies to last till the next winter season.
-Source: The Hindu
Account Aggregator (AA) platform goes live
Context:
Thousands of Indians have signed up for and are using the apex bank-regulated account aggregator (AA) platform in less than two months of it going live.
Relevance:
Prelims, GS-III: Indian Economy (Growth and Development of Indian Economy, Banking)
Dimensions of the Article:
- About the Account Aggregator (AA) network
- How does the AA network work?
- Why was AA needed?
About the Account Aggregator (AA) network
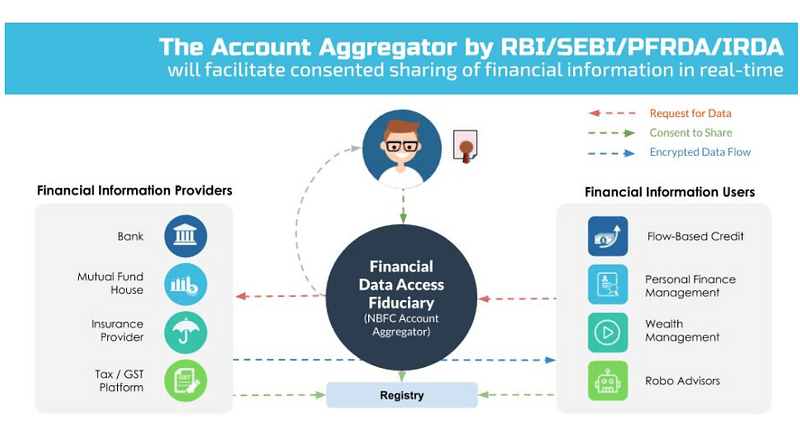
- The Account Aggregator (AA) network simply facilitates sharing of financial information in a real-time and data-blind manner (Data flow through AA are encrypted) between regulated entities (Banks and NBFCs).
- AA solves the problem of data scattered across financial institutions and enables it to be brought to one place with customer consent and in a data-blind manner where the AA cannot view or process the data.
- The RBI (Reserve Bank of India) in 2016 approved AA as a new class of NBFC (Non Banking Financial Companies), whose primary responsibility is to facilitate the transfer of user’s financial data with their explicit consent.
How does the AA network work?
- The AA network features financial institutions such as banks, NBFCs, NBFC-AAs, third-party services, and others.
- Banks act as financial data providers, lenders act as financial data seekers, NBFC-AAs act as mediums of communication between banks and lenders, and third-party service providers work with AAs.
- First, an individual or business opens an account with an account aggregator. Then, they create a funnel for their financial data by linking their bank accounts, insurance policies, etc., — which are accounts containing the customer’s financial data.
- Second, the customer can provide consent to a lender to access their financial data through the NBFC-AA. This usually happens when the customer is looking for a loan or some other financial product that requires their financial information to be collated.
- Third, after consent is provided, the account aggregator seeks permission from the financial data providers to access the customer’s data.
- And finally, the data is sent to the account aggregator, which, in turn, empowers lenders to better evaluate the customer’s financial profile and risk associated with providing a loan.
Why was AA needed?
- Before AA came into the picture, entities used a process called screen scraping where third-party applications collect screen data and translate it to display on another application. An expert said as there was no uniformity across entities there were inefficiencies and problems whenever a bank would bring changes to their applications.
- Additionally, it was sensitive information being viewed through the screen scraping process. AA was the natural solution to it in the form of user consent driven architecture, the expert added.
- The AA ecosystem makes it a regulated and legitimate process with all regulated entities involved.
-Source: Livemint
Climate Change and its impact on El Nino and La Nina
Context:
There is a growing body of research suggesting that climate change can cause extreme and more frequent El Niño and La Niña events.
Relevance:
GS-I: Geography (Climatology, Important Geophysical Phenomena), GS-III: Environment and Ecology (Environmental Pollution and Degradation, Impact of Climate Change)
Dimensions of the article:
- La Niña
- El Niño
- About the Recent Findings on La Nina and El Nino
- ENSO
La Niña
- La Niña is a coupled ocean-atmosphere phenomenon that is the colder counterpart of El Niño, as part of the broader El Niño–Southern Oscillation (ENSO) climate pattern.
- is a coupled ocean-atmosphere phenomenon that is the colder counterpart of El Niño, as part of the broader El Niño–Southern Oscillation (ENSO) climate pattern.
- During a period of La Niña, the sea surface temperature across the equatorial Eastern Central Pacific Ocean will be lower than normal by 3 to 5 °C (5.4 to 9 °F).
- An appearance of La Niña persists for at least five months.
- It has extensive effects on the weather across the globe, particularly in North America, even affecting the Atlantic and Pacific hurricane seasons, in which more tropical cyclones occur in the Atlantic basin due to low wind shear and warmer sea surface temperatures, while reducing tropical cyclogenesis in the Pacific Ocean.
- La Niña is a complex weather pattern that occurs every few years, as a result of variations in ocean temperatures in the Equatorial Pacific.
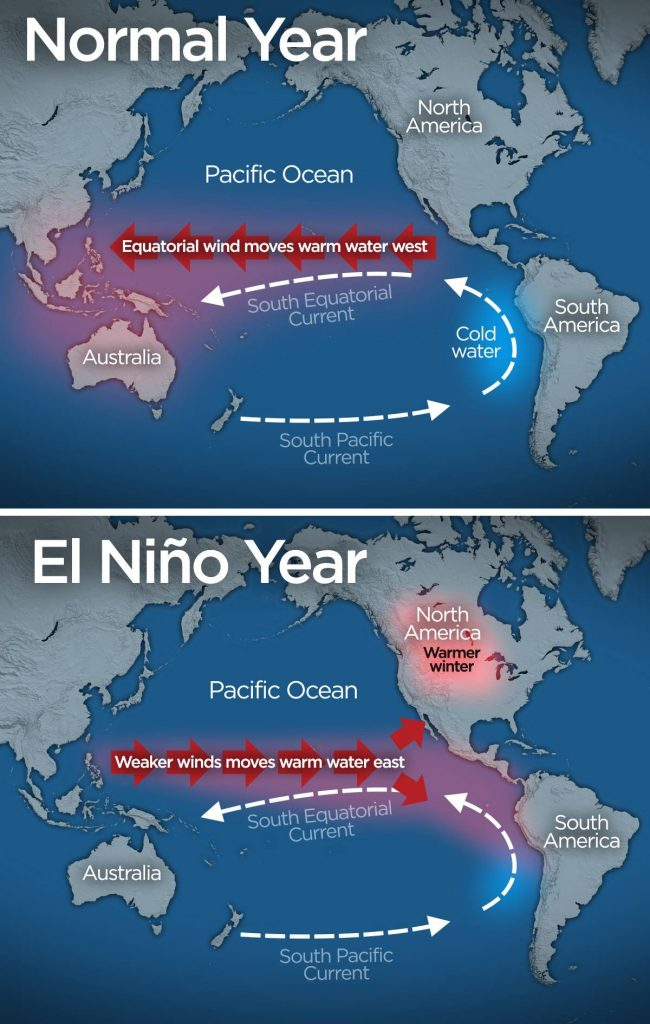
- It occurs as strong winds blow warm water at the ocean’s surface from South America across the Pacific Ocean towards Indonesia.
- As this warm water moves west, cold water from the deep sea rises to the surface near South America.
- As a result, it is considered to be the cold phase of the broader El Niño–Southern Oscillation weather pattern, as well as the opposite of El Niño weather pattern.
- La Niña impacts the global climate and disrupts normal weather patterns, which as a result can lead to intense storms in some places and droughts in others.
El Niño
- El Niño is the warm phase of the El Niño–Southern Oscillation (ENSO) and is associated with a band of warm ocean water that develops in the central and east-central equatorial Pacific (between approximately the International Date Line and 120°W), including the area off the Pacific coast of South America.
- The ENSO is the cycle of warm and cold sea surface temperature (SST) of the tropical central and eastern Pacific Ocean.
- El Niño is accompanied by high air pressure in the western Pacific and low air pressure in the eastern Pacific.
- During the development of El Niño, rainfall develops between September–November.
- The cool phase of ENSO is La Niña, with SSTs in the eastern Pacific below average, and air pressure high in the eastern Pacific and low in the western Pacific.
- The ENSO cycle, including both El Niño and La Niña, causes global changes in temperature and rainfall.
About the Recent Findings on La Nina and El Nino
- Increasing atmospheric carbon dioxide can cause a weakening of future simulated El Nino-Southern Oscillation (ENSO) sea surface temperature variability.
- Future El Niño events will lose heat to the atmosphere more quickly due to the evaporation of water vapour. Also, in the future there will be a reduced temperature difference between the eastern and western tropical Pacific, inhibiting the development of temperature extremes during the ENSO cycle.
- There can be a weakening of Tropical Instability Waves (TIWs) in the projected future which can cause a disruption of the La Niña event. TIWs are a dominant feature of monthly variability in the equatorial Pacific and Atlantic Ocean.
ENSO
- El Nino and the Southern Oscillation, also known as ENSO is a periodic fluctuation in sea surface temperature (El Niño) and the air pressure of the overlying atmosphere (Southern Oscillation) across the equatorial Pacific Ocean.
- El Nino and La Nina are complex weather patterns resulting from variations in ocean temperatures in the Equatorial Pacific Region. They are opposite phases of what is known as the ENSO cycle.
- El Nino and La Nina episodes typically last nine to 12 months, but some prolonged events may last for years.
-Source: Financial Express
IUCN assessment on species facing extinction
Context:
The International Union for the Conservation of Nature (IUCN) assessed species for its survival watchlist said that over 25% of them are now at high risk of vanishing forever.
Relevance:
GS-III: Environment and Ecology (Important International Institutions, Conservation of Ecology and Biodiversity)
Dimensions of the Article:
- Highlights of the IUCN findings
- About the IUCN and its Red list
Highlights of the IUCN findings
- Some 28% of the 1,38,374 species assessed by the International Union for the Conservation of Nature (IUCN) for its survival watchlist are now at high risk of vanishing forever.
- Habitat loss, overexploitation and illegal trade have hammered global wildlife populations for decades, and climate change is now kicking in as a direct threat as well, the IUCN reported.
- Some 37% of the 1,200 shark and ray species assessed by experts are directly threatened by extinction, a third more than only seven years ago, it warned.
- Indonesia’s fearsome Komodo dragons were listed as “endangered” as the species “is increasingly threatened by the impacts of climate change” said the the IUCN, with rising sea levels expected to shrink its tiny habitat by at least 30% over the next 45 years.
IUCN on Raptor Species under Threat
- Around 30% of the 557 raptor species around the world are threatened by extinction to some degree.
- Some vulture populations have declined by over 95% in Asian countries such as India because of the widespread use of diclofenac (which is a non-steroidal anti-inflammatory drug).
- The population of Philippine eagles (Critically Endangered under IUCN Red List), the largest variety of eagles in the world, decreased rapidly in the last decades due to extensive deforestation.
- In Africa, vulture populations have decreased by an average of 95% in rural areas over the last 30 years as the result of shooting and poisoning through feeding on carcasses of livestock treated with diclofenac.
- The Annobon scops-owl, restricted to Annobon Island off West Africa, was recently classified as ‘critically endangered’ under the IUCN Red List because of rapid habitat loss and degradation.
About the IUCN and its Red list
- Established in 1964, the International Union for Conservation of Nature’s (IUCN) Red List of Threatened Species has evolved to become the world’s most comprehensive information source on the global extinction risk status of animal, fungus and plant species.
- The IUCN Red List is a critical indicator of the health of the world’s biodiversity. It provides information about range, population size, habitat and ecology, use and/or trade, threats, and conservation actions that will help inform necessary conservation decisions.
- The IUCN Red List is used by government agencies, wildlife departments, conservation-related non-governmental organisations (NGOs), natural resource planners, educational organisations, students, and the business community.
The main objectives are:
- Identification and documentation of endangered species.
- Providing a global index of the decline of biodiversity.
- Developing awareness about the importance of threatened biodiversity.
- Defining conservation priorities at the local level and guiding conservation action.
Every four years, IUCN convenes the IUCN World Conservation Congress to set the global conservation agenda.
About the criteria for the IUCN Red List
The IUCN system uses a set of five quantitative criteria to assess the extinction risk of a given species. In general, these criteria consider:
- The rate of population decline.
- The geographic range.
- Whether the species already possesses a small population size.
- Whether the species is very small or lives in a restricted area.
- Whether the results of a quantitative analysis indicate a high probability of extinction in the wild.
-Source: The Hindu, Down to Earth Magazine


