Why in News ?
- A 2025 study by Bharathidasan University (Tiruchirappalli), published in Environmental Earth Sciences (Aug 2025), found high levels of heavy metals (notably cadmium and lead) in Cauvery River sediments and fish.
- The study warns that regular fish consumption from the river may pose serious non-carcinogenic and carcinogenic health risks.
- Supported by earlier studies (2024, Frontiers in Public Health), confirming bioaccumulation of toxic metals in multiple fish organs.
Relevance:
- GS-3 (Environment & Ecology):
• River pollution, bioaccumulation, and ecological risk analysis.
• Implementation gaps in Water Act and environmental regulation.
• Sustainable river management and public health implications. - GS-2 (Governance):
• Institutional coordination between CPCB, TNPCB, and local bodies.
• Policy enforcement and community awareness mechanisms.
Background: Cauvery River & Its Socio-Ecological Importance
- Lifeline of Karnataka and Tamil Nadu; supports drinking water, irrigation, and fisheries.
- Flows through industrial hubs like Erode and Tiruchirappalli, which discharge effluents directly into the river.
- Increasing urbanisation, agriculture runoff, and industrialisation have aggravated pollution.
Study Overview
- Scope:
- Sediment samples: 18 sites along the river.
- Fish samples: 10 sites, multiple species.
- Methods: Atomic Absorption Spectroscopy; multivariate statistical analysis; EPA-based health risk assessment.
- Indices Used:
- Igeo (Geoaccumulation Index) – metal buildup in sediments.
- Contamination Factor (CF) – element enrichment relative to background.
- Pollution Load Index (PLI) – overall contamination intensity.
- Potential Ecological Risk (PERI) – ecological toxicity measure.
Key Findings
- Metals studied: Chromium (Cr), Cadmium (Cd), Copper (Cu), Lead (Pb), Zinc (Zn).
- Major contaminants: Cadmium and Lead – exceeded safety thresholds.
- Variation: Spatially uneven contamination — highest near industrial stretches (Erode belt).
- Bioaccumulation pattern (across organs):
- Liver & gills: Highest metal concentration (filtering organs).
- Muscle tissue: Detected levels unsafe in some species — critical as it is the edible part.
- Target Hazard Quotient (THQ): Exceeded 1 for several metals → potential health concern.
- Primary Sources:
- Industrial effluents (textile dyeing, electroplating).
- Agricultural runoff (fertilisers, pesticides).
- Untreated sewage.
- Minor natural input from mineralised zones (Fe, Mn).
Human Health Implications
- Cadmium (Cd):
- Chronic exposure → kidney dysfunction, bone fragility, cancer risk.
- Lead (Pb):
- Neurological and developmental damage, especially in children.
- Chromium (Cr):
- Carcinogenic (Cr⁶⁺), causes liver/kidney damage.
- Cumulative Risk:
- Regular fish consumption may cause bioaccumulation and biomagnification in humans.
- Safe Limit: 250 g per serving, twice a week (as per Dr. Rajendran).
Ecological Implications
- Food Chain Contamination: Metals move from sediments → plankton → fish → humans.
- Biodiversity Impact:
- Sublethal toxicity → reproductive, growth, and metabolic issues in aquatic life.
- Alters trophic dynamics and benthic organism survival.
- Sediment Pollution: Acts as a long-term pollutant reservoir, continuously leaching toxins.
Distinguishing Human vs Natural Sources
- Using Igeo and Ecological Risk Index (ERI) with multivariate statistics, the study found:
- Cd, Pb, Cr: Largely anthropogenic (industrial origin).
- Fe, Zn: Natural/mineral sources.
- Confirms urban-industrial pollution dominance over natural background levels.
Regional Context
- Similar contamination patterns found in Noyyal River (SRM Institute study, 2024) — linking Tamil Nadu’s industrial belts with systemic water pollution.
- Indicates state-wide challenge of managing industrial effluents and weak enforcement of Tamil Nadu Pollution Control Board (TNPCB) norms.
Policy and Governance Dimensions
- Environmental Regulation Gaps:
- Ineffective enforcement of Water (Prevention and Control of Pollution) Act, 1974.
- Lack of real-time effluent monitoring for small/medium industries.
- Needed Actions:
- Establish continuous river-monitoring stations.
- Strengthen CPCB–TNPCB coordination.
- Implement Zero Liquid Discharge (ZLD) norms strictly in textile hubs.
- Promote bio-remediation and constructed wetlands for effluent filtration.
- Public Health Strategy:
- Issue fish consumption advisories.
- Conduct biomonitoring of local populations (Cd & Pb exposure).
- Enhance community awareness in riparian districts.
Scientific and Policy Significance
- First multi-metal, multi-organ study on fish in the Cauvery Basin.
- Provides quantitative baseline data for future environmental risk models.
- Offers scientific evidence for regulatory design and ecological restoration planning.
- Strengthens argument for integrated river basin management (IRBM) in India.
Broader Environmental Lessons
- Symbol of India’s urban-industrial river crisis (like Yamuna, Sabarmati).
- Highlights disconnect between economic growth and ecological health.
- Calls for science-led, locally adapted pollution control frameworks.
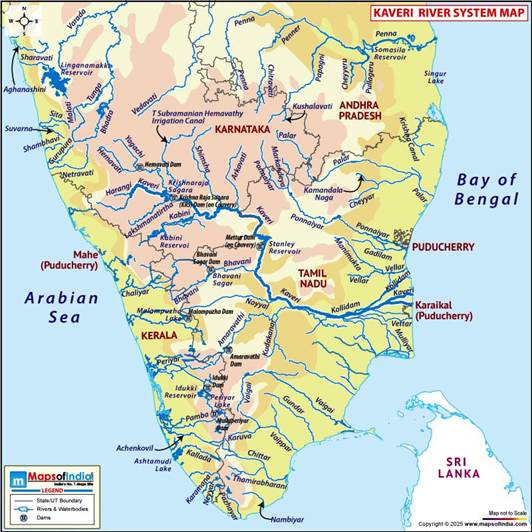
Cauvery River: Physical Geography Basics
Origin
- Source: Talakaveri, Brahmagiri Hills, Western Ghats (Kodagu district, Karnataka)
- Elevation: ~1,341 m above mean sea level
- Mythological significance: Considered sacred; mentioned in Skanda Purana as Dakshina Ganga.
Course
- Total length: ~805 km
- Karnataka: ~320 km
- Tamil Nadu: ~416 km
- Kerala & Puducherry (minor stretches): ~69 km combined
- Flow direction: Initially east-southeast → enters Tamil Nadu near Dharmapuri → forms delta near Thanjavur → drains into Bay of Bengal.
Drainage Basin
- Total Basin Area: ~81,155 sq. km
- Karnataka: ~34,300 sq. km
- Tamil Nadu: ~43,900 sq. km
- Kerala: ~2,800 sq. km
- Puducherry: ~155 sq. km
Major Tributaries
Right Bank Tributaries
- Harangi (Kodagu district)
- Hemavati (origin – Ballala Hills)
- Shimsha (Maddur)
- Arkavathi (joins near Kanakapura)
- Suhavathi (Suvarnavathi)
- Noyyal (joins in Tamil Nadu near Karur)
- Amaravati (major tributary in Tamil Nadu)
Left Bank Tributaries
- Kabini (origin – Wayanad plateau, Kerala)
- Bhavani (joins near Erode, Tamil Nadu)
- Lokapavani
- Palar (minor)
Major Dams & Reservoirs
- Krishna Raja Sagar (KRS) – Karnataka (near Mysuru)
- Mettur Dam (Stanley Reservoir) – Tamil Nadu
- Kabini Dam, Harangi Dam, Hemavathi Reservoir


