Content
- What’s the Plan to Relocate Forest Tribes?
- Over 70% of India’s Prisoners Still Awaiting Trial: SC Judge
- Nutritional Transformation: From Food Security to Nutritional Security
- Expectations from COP30: The ‘Implementation COP’ at Belém, Brazil
- India’s First Indoor Air Quality (IAQ) Scale Developed by BITS Hyderabad
- Story of India’s Withdrawal from Overseas Airbase in Tajikistan (Ayni Airbase)
What’s the plan to relocate forest tribes?
Why in News?
- The Ministry of Tribal Affairs (MoTA) has released a new policy framework titled “Reconciling Conservation and Community Rights: A Policy Framework for Relocation and Co-existence in India’s Tiger Reserves” (October 2024).
- It was issued after the NTCA directive (June 2024) urged states to prioritise relocation from tiger reserves — triggering protests by Gram Sabhas and representations to NCST.
- Aims to address conflict between wildlife conservation and tribal rights, especially under the Forest Rights Act (FRA), 2006.
Relevance:
GS 2 – Governance, Welfare Schemes, Rights Issues
• Forest Rights Act (FRA), 2006 and Scheduled Tribes’ rights
• Balancing conservation with human livelihood security
• Participatory governance and Gram Sabha empowerment
• Displacement, rehabilitation, and social justice in policy
• Constitutional provisions – Article 46, Fifth Schedule
GS 3 – Environment & Sustainable Development
• People-centric conservation vs. fortress conservation
• Biodiversity protection and eco-sensitive zones
• Human–wildlife conflict management and sustainable livelihoods
Background and Context
- Tiger Reserves: Established under Project Tiger (1973); governed by the Wildlife Protection Act (WPA), 1972.
- FRA, 2006: Recognises rights of forest-dwelling Scheduled Tribes (FDSTs) and Other Traditional Forest Dwellers (OTFDs) to land and forest resources.
- Conflict: WPA promotes exclusionary conservation; FRA promotes community rights → policy vacuum on co-existence.
- NTCA data (June 2023):
- 591 villages and 64,801 families lived within tiger reserve core areas.
- Since Jan 2022: 5,166 families from 56 villages relocated in 7 States (MP, Karnataka, Jharkhand, Maharashtra, Odisha, WB, Rajasthan).
The Issue
- Tribes allege forced or induced relocation:
- Denial of basic services (schools, health centres, water, electricity) to push voluntary exit.
- Example: Jenu Kuruba community in Nagarhole NP (Karnataka) — case in HC claiming violation of FRA rights.
- Current Compensation: ₹15 lakh/family (NTCA guidelines) for voluntary relocation.
- Implementation Gap: Rights not settled under FRA before eviction; consent procedures weak or symbolic.
Key Features of the New Policy Framework
Core Objective
- Ensure “voluntary, rights-compliant, and scientifically justified relocation” — not administrative compulsion.
- Promote co-existence model where possible, rather than eviction.
Procedural Safeguards
- Rights Settlement First: FRA rights must be recognised before any relocation.
- Consent Mechanism:
- Consent required before an area is notified as a tiger reserve.
- Must be obtained at Gram Sabha and household level; verifiable through independent audit.
- Monitoring & Oversight:
- Establish National Database on Conservation-Community Interface (NDCCI) to track:
- Relocation status
- Compensation paid
- Post-relocation livelihood outcomes
- Annual independent audits by empanelled agencies on FRA & WPA compliance.
- Establish National Database on Conservation-Community Interface (NDCCI) to track:
Institutional Collaboration
- Calls for a National Framework for Community-Centred Conservation and Relocation, jointly managed by:
- Ministry of Tribal Affairs (MoTA)
- Ministry of Environment, Forest & Climate Change (MoEFCC)
- Mandates greater role for MoTA in relocation planning, approval, and grievance redressal.
What Happens to Those Who Stay?
- FRA allows continued residence within tiger reserves:
- Rights to habitat, minor forest produce, grazing, fishing, etc.
- Participation in conservation and eco-tourism.
- Administration must ensure basic infrastructure and public services for those choosing to stay.
- Framework insists on inclusion of communities in biodiversity management committees.
Constitutional & Legal Principles
- Based on Article 46 (promotion of Scheduled Tribes’ interests) and Fifth Schedule (protection of tribal areas).
- Emphasises the “affirmative constitutional duty” of the State to safeguard FRA rights;
- Curtailment only upon demonstrable ecological necessity.
- Aligns with India’s obligations under UNDRIP (United Nations Declaration on the Rights of Indigenous Peoples) and CBD (Convention on Biological Diversity).
Why the Framework Matters?
- Bridges the gap between two conflicting conservation models — fortress conservation vs rights-based conservation.
- Prevents human rights violations and illegal evictions, previously flagged by NCST and civil society.
- Brings data-driven transparency and accountability to relocation processes.
- Encourages community participation in conservation, promoting sustainable coexistence.
Data & Current Situation
| Parameter | Data (as of 2024) |
| Total Tiger Reserves | 55 reserves (≈2.3% of India’s area) |
| Villages in Core Areas | 591 villages |
| Families in Core Areas | 64,801 families |
| Families Relocated (since 2022) | 5,166 families from 56 villages |
| Relocation Package | ₹15 lakh per family |
| Lead Agencies | NTCA (MoEFCC) & MoTA |
| Key Litigation Example | Jenu Kuruba vs State of Karnataka (Nagarhole NP) |
Way Forward
- MoTA to circulate framework to all State Tribal Welfare & Forest Departments down to district level.
- Joint MoTA–MoEFCC monitoring committee to oversee implementation.
- Independent audits & NDCCI to ensure transparency in compensation and consent verification.
- Policy evaluation every 3 years for adaptive reforms based on ground realities.
Conclusion
- The new policy framework is a corrective step acknowledging that tiger conservation and tribal livelihoods are mutually reinforcing, not mutually exclusive.
- True success will depend on:
- Genuine Gram Sabha consent
- Rights recognition before relocation
- Monitoring post-relocation welfare
- India’s conservation model is thus evolving from “people vs parks” to “people with parks” — aligning ecological integrity with social justice.
Over 70% of India’s prisoners still awaiting trial: SC judge
Why in News?
- A report (2019–2024) released by Square Circle Clinic, the Fair Trial Programme (FTP) of NALSAR University of Law, Hyderabad, revealed systemic failures in India’s legal aid system.
- The findings were discussed by Justice Vikram Nath (Supreme Court), who termed them “disturbing” and called for urgent legal aid reforms.
- The report gains importance amid the fact that over 70% of India’s prison inmates are undertrials, highlighting deep inequities in access to justice.
Relevance:
GS 2 – Polity & Governance, Judiciary, Social Justice
• Access to justice and judicial reforms (Article 39A)
• Undertrial crisis and prison reforms under Article 21
• Legal aid institutions – NALSA & DLSA
• Bail reforms and CrPC 436A provisions
• Human rights, overcrowding, and inclusive governance
Background — The Problem of Undertrials in India
- As per NCRB 2022–23 data:
- 77.1% of India’s prison population are undertrials (individuals not yet convicted).
- India’s prisons house 4.9 lakh+ prisoners, of which 3.8 lakh+ are undertrials.
- Overcrowding rate: ~131% nationally (Bihar, UP, MP among the worst).
- Constitutional context:
- Article 21: Right to life includes right to fair and speedy trial.
- Article 39A: Ensures free legal aid to economically weaker sections.
- Section 436A CrPC: Undertrials who have spent half of the maximum possible sentence in jail are eligible for release.
- Ground reality:
- Low awareness of legal rights.
- Mechanical bail applications.
- Poor implementation of legal aid through District Legal Services Authorities (DLSAs).
The Fair Trial Programme (FTP) — NALSAR’s Initiative
- Launched: 2019
- Supported by: NALSAR University of Law, Hyderabad
- Operating in: Nagpur and Yerawada Central Prisons
- Objective:
To ensure constitutional and procedural justice to undertrials through professional legal assistance, research, and rehabilitation support.
Case Study: Nita Devi’s Story
- Married at 16, survivor of domestic violence, later accused (allegedly falsely) of killing her children (2017).
- Spent over 5 years in prison before bail in 2022, secured through FTP lawyers.
- Diagnosed with mental illness, now rehabilitated and working at the clinic — exemplifying FTP’s reintegration approach.
Key Findings of the 2019–2024 FTP Report
| Indicator | Data/Findings |
| Total cases handled | 5,783 |
| Accused without any lawyer | 41.3% |
| Accused lacking essential documents | 51% |
| Undertrials with at least one disability | 58% |
| From disadvantaged caste groups (SC/ST/OBC) | 67.6% |
| Working in unorganised sector | 79.8% |
| Bail applications filed | 1,834 |
| Cases disposed | 777 |
| Clients released (bail/closure) | 1,388 (in 2,542 cases) |
Key Observations:
- Many undertrials had spent more time in prison than the maximum punishment for their alleged offences.
- Only 7.91% of undertrials in India have accessed legal aid (Justice Nath’s data).
- Bail pleas often filed mechanically, lacking documents or sureties, trapping poor accused in jail.
Judicial Concerns Highlighted by Justice Vikram Nath
- Access inequality: Legal aid remains theoretical; actual awareness is minimal.
- Structural flaw: DLSAs are underfunded and overburdened; need independent legal aid monitoring.
- Violation of Article 21: Delay, lack of counsel, and non-compliance with CrPC 436A erode fair trial rights.
- Justice delayed = justice denied: Many prisoners exceed their possible sentence term.
Significance of the FTP Model
- Bridges law schools with justice delivery: Real-time clinical legal education.
- Human rights focus: Treats undertrials as citizens with dignity, not statistics.
- Rehabilitation-oriented: Helps mental health, reintegration, and livelihood of released undertrials.
- Empirical justice: Data-backed interventions for judicial reform.
Systemic Issues in India’s Criminal Justice
- Overburdened lower judiciary: ~5 crore pending cases.
- Poor investigation standards: Low conviction rates (e.g., 57% for IPC crimes in 2022).
- Socio-economic bias: Majority of inmates poor, illiterate, marginalised.
- Gendered injustice: Women undertrials (4%) often victims of abuse and stigma.
Policy Recommendations Emerging from the Report
- Strengthen Legal Aid System:
- Independent Legal Aid Commission under Article 39A.
- Regular legal literacy camps inside prisons.
- Bail Reforms:
- Implement Bail Act (UK-style) norms — reasoned bail decisions and affordability checks.
- Strict monitoring of CrPC 436A compliance.
- Integration of Law Schools & NGOs:
- Scale up Fair Trial Clinics to all law universities.
- Digital Prison Records:
- Real-time tracking of undertrial periods, lawyer status, and case progress.
- Mental Health & Social Reintegration:
- Dedicated paralegal volunteers and psychosocial counsellors in jails.
Way Forward
- Justice Nath’s call reflects the need for a “Justice Delivery Ecosystem” that includes judiciary, academia, civil society, and prisons.
- FTP-type models should be institutionalised through National Legal Services Authority (NALSA).
- A shift from “incarceration as default” to “bail as the rule” is essential to uphold Article 21 and 39A.
Conclusion
- The NALSAR Fair Trial Programme exposes deep cracks in India’s criminal justice system — not just in laws, but in lived justice.
- It proves that access to justice is the first step toward restoring constitutional morality.
- For India to remain a true rule-of-law democracy, no one should be punished merely for being poor, uninformed, or unrepresented.
Nutritional Transformation
Why in News?
- Article discussed the rise of functional foods and smart proteins as part of India’s evolving food ecosystem.
- The piece highlighted the need to shift focus from food security (calories) to nutritional security (balanced nourishment) amid persistent malnutrition and emerging “lab-grown” food technologies.
- It also reviewed the global regulatory progress and India’s policy preparedness to handle these food innovations.
Relevance:
GS 3 – Science & Technology, Food Security & Nutrition
• Nutrigenomics, bio-fortification, and bioprocessing innovations
• Transition from food security to nutritional security
• Smart protein ecosystem – plant-based, fermentation, cultivated meat
• Sustainable agriculture and circular bioeconomy
• Regulatory frameworks – FSSAI, biotechnology safety, and innovation policy
GS 2 – Governance & Health
• Nutritional policy and public health linkages (SDG 2, 3)
• Public–private partnerships and R&D ecosystem for food innovation
Functional Foods — Definition and Technologies
- Functional Foods: Foods enriched with additional nutrients or compounds that promote health and prevent disease.
- Examples:
- Vitamin-enriched rice, iron-fortified wheat, omega-3 fortified milk, probiotic curd, etc.
- Technologies Involved:
- Nutrigenomics: Studies how nutrients interact with genes to influence health outcomes.
- Biofortification: Conventional breeding/genetic techniques to increase micronutrient content (e.g., zinc rice, iron millet).
- 3D Food Printing: Enables nutrient-controlled and personalized food structures.
- Bioprocessing: Uses microbial fermentation to enhance food quality, safety, and digestibility.
Smart Proteins — Definition and Types
Smart Proteins: Protein alternatives developed through biotechnology to reduce dependence on animal-based meat and dairy.
Categories:
- Plant-based proteins: Extracts from legumes, cereals, or oilseeds restructured to mimic meat/dairy.
- Fermentation-derived proteins: Produced using microbes (precision fermentation) to create dairy proteins, egg whites, etc.
- Cultivated (cell-based) meat: Animal cells grown in bioreactors — no slaughter involved.
Why is Nutritional Security Essential for India?
- Persistent Malnutrition:
- NFHS-5 (2019–21):
- 35.5% of children under 5 are stunted.
- 32% are underweight.
- 57% of women aged 15–49 are anaemic.
- Protein Deficiency: Average Indian adult consumes ~50–55 g/day, below ICMR’s 60 g/day recommendation.
- NFHS-5 (2019–21):
- Urban–Rural Divide: Urban diets improving, rural India lags in protein and micronutrient intake.
- Policy Evolution Needed:
- India has achieved food grain self-sufficiency, but not nutritional adequacy.
- Shift needed from “calorie security” → “nutrition security” to meet SDG 2 (Zero Hunger) and SDG 3 (Good Health).
- Sustainability Factor:
- Agriculture contributes ~18% of India’s GHG emissions, largely from livestock.
- Smart proteins and functional foods can reduce carbon footprint while enhancing nutrition.
Global Scenario
| Country/Region | Initiative / Status |
| Singapore | First country to approve commercial sale of cultivated chicken (2020) by Eat Just. |
| China | Prioritised alternative proteins under national food security and innovation strategy. |
| European Union | Investing heavily through Farm to Fork Strategy — aims to cut conventional meat production and boost sustainable proteins. |
| United States | FDA approved lab-grown chicken (2023) for sale by UPSIDE Foods and Good Meat. |
Smart Protein Ecosystem — Global and Indian Context
- Global Market Projection:
- UBS (2023): $85 billion by 2030.
- Credit Suisse (2024): $240 billion by 2030.
- India’s Potential:
- Strong agricultural base + expanding biotech & food processing sectors.
- Early players: GoodDot, Blue Tribe Foods, Shaka Harry, Evo Foods.
- Backed by Good Food Institute India (GFI India) and CII Smart Protein Summit.
- Employment & Economic Opportunity:
- Potential to create thousands of jobs in agriculture, manufacturing, logistics, and biomanufacturing.
- Supports India’s Make-in-India and Bioeconomy Vision 2047 (target: $300 billion bioeconomy).
Challenges
- Policy & Regulation:
- Lack of clear definitions, safety standards, and labelling norms under FSSAI.
- Risk of mislabelled or unverified “functional” products flooding the market.
- Economic Barriers: High R&D cost, limited venture capital for biomanufacturing infrastructure.
- Workforce Mismatch: Need for upskilling farmers and technicians for biotech-driven food systems.
- Market Concentration: Fear of monopolisation by a few large corporations.
- Public Scepticism: “Lab-made” foods face emotional, ethical, and religious distrust.
Tackling Public Scepticism and Policy Path Ahead
Building Trust and Transparency
- Public education campaigns on safety, sustainability, and nutrition benefits.
- Involve consumer advocacy groups and scientific communicators.
Strong Regulatory Framework
- FSSAI to establish:
- Definitions for functional, smart, and novel foods.
- Rigorous safety assessment and labelling guidelines.
- Distinction between natural fortification and synthetic enhancement.
Inter-Ministerial Coordination
- Collaboration between MoHFW, FSSAI, DBT, ICAR, and MoFPI for coherent policy support.
Public–Private Partnerships
- Joint R&D, precision fermentation facilities, and biofoundry ecosystems.
- Funding through Startup India and BioNEST platforms.
Farmer Inclusion
- Integrate farmers into plant-protein supply chains (soy, pulses, millets).
- Promote biofortified crop cultivation for functional food inputs.
Way Forward
- Develop National Strategy on Functional & Smart Foods aligned with Nutrition Mission @2047.
- Launch BioNutrition Mission under DBT–FSSAI partnership.
- Focus on affordability, safety, and accessibility to avoid urban bias in “nutritional transformation.”
- Encourage biomanufacturing hubs in agricultural states for regional balance.
Conclusion
- Functional foods and smart proteins represent India’s next leap in the food–health–climate nexus.
- As India moves from food sufficiency to nutrition sufficiency, biotechnology will be central to achieving nutritional security, sustainability, and health equity.
- The real challenge lies in ensuring that this transition is scientifically sound, ethically transparent, socially inclusive, and environmentally sustainable.
Expectations from COP30
Why in News ?
- The 30th UN Climate Change Conference (COP30) begins in Belém, Brazil, marking 10 years since the Paris Agreement (2015).
- It is being termed the “Implementation COP”, as nations are expected to translate pledges into concrete action, guided by the Global Stocktake (GST).
- Symbolic setting: Belém, gateway to the Amazon Rainforest, one of the largest carbon sinks (~150–200 billion tonnes of carbon) and a key biodiversity hotspot under threat.
Relevance:
GS 3 – Environment & Sustainable Development
• Global climate governance and COP framework
• Climate finance – Loss & Damage Fund, NCQG
• Global Goal on Adaptation and carbon neutrality targets
• India’s climate diplomacy and CBDR principle
• National policies – LiFE Mission, Green Hydrogen, Net Zero 2070
GS 2 – International Relations
• Global South leadership in climate negotiations
• India’s role in UNFCCC, G77+China, and SDG alignment
Background: From Paris to Belém
- Paris Agreement (2015): Limit global warming to well below 2°C and ideally 1.5°C.
- Challenge: Despite pledges, global emissions continue to rise; climate finance remains inadequate.
- Context for COP30: Rising public frustration, intensifying climate impacts, and record global heat in 2024–25.
Why COP30 is Called the ‘Implementation COP’ ?
- Objective: Move from commitments → concrete outcomes.
- Guided by: Global Stocktake (GST) – 5-yearly review under Paris Agreement to assess progress, gaps, and future plans.
- Focus Areas (6 Transition Pillars):
- Energy, Industry & Transport transitions (decarbonisation)
- Forests, Oceans & Biodiversity stewardship
- Transformation of food systems
- Urban resilience (cities, infrastructure, water)
- Human & Social development
- Finance, technology & capacity building
Finance: The Central Challenge
Baku-to-Belém Roadmap on Climate Finance
- Joint initiative by Azerbaijan and Brazil (COP Presidencies).
- Aims to mobilise $1.3 trillion/year by 2035 for developing nations.
- Linked to COP29’s New Collective Quantified Goal (NCQG):
- $300 billion annually by 2035, tripling the previous $100 billion target.
- But far short of the $1–2 trillion annual need estimated by developing economies.
Issues
- “All actors” (public, private, MDBs, philanthropies) clause dilutes Common but Differentiated Responsibilities (CBDR).
- Loss & Damage Fund (COP28): < $1 billion pledged vs. hundreds of billions required annually.
- Developing nations demand predictable, concessional, and additional finance beyond loans.
Adaptation: Towards a Global Goal on Adaptation (GGA)
- GGA seeks to establish measurable targets and financing for resilience.
- Long-delayed framework expected to be finalised at COP30.
- India’s example: Local resilience models — traditional seed varieties, water harvesting, community-based restoration.
- Inclusion of indigenous and local knowledge is crucial for region-specific adaptation.
Climate-Nature Nexus: Amazon at the Centre
- Brazil’s “Tropical Forest Forever Facility” proposal:
- Financial mechanism to reward 70+ tropical forest nations for conservation efforts.
- Represents a shift to integrate climate and biodiversity financing.
- Funds to support ecosystem restoration, agroforestry, and community conservation.
Transition and Technology
- Fair (Just) Transition:
- Net-zero transition must not deepen inequality.
- Requires technology access, capacity building, and affordable innovation.
- Barriers:
- High tech costs, IP restrictions on green technologies, lack of training.
- India’s strategy:
- Focus on low-carbon manufacturing, renewables, green skill development, and carbon market (by 2026).
India’s Role and Position
- Leadership in G77 + China bloc: Advocating for climate justice and CBDR principle.
- Push for fair NCQG and predictable finance.
- Domestic actions:
- NDC targets (2030): 45% emissions intensity reduction, 50% installed capacity from non-fossil fuel.
- Green bonds, National Green Hydrogen Mission, Energy Transition Mechanism, LiFE initiative (Lifestyle for Environment).
- Challenge: Institutional readiness and implementation lag.
- Opportunity: Shape North-South cooperation and champion Global South concerns.
Key Numbers to Remember
| Parameter | Target/Value | Source |
| Paris Temperature Goal | <2°C (preferably 1.5°C) | UNFCCC |
| Global Stocktake | Every 5 years | Paris Agreement |
| NCQG Target (COP29) | $300 bn/year by 2035 | COP29 Baku |
| Long-term Finance Vision | $1.3 trillion/year | Baku–Belém Roadmap |
| Amazon Carbon Stock | ~150–200 billion tonnes | IPCC |
| Submitted NDCs (by emissions share) | ~94% of global emissions | Climate Action Tracker (2025) |
Key Takeaways
- Implementation COP: Shifting from “pledges to performance.”
- Finance bottleneck: Core barrier to Global South participation.
- India’s stance: Climate justice + development space.
- Belém symbolism: Climate-biodiversity link; Amazon’s centrality to resilience.
- Expected outcomes:
- Finalisation of GGA
- Operationalisation of NCQG framework
- Launch of Tropical Forest Facility
- NDC updates for 2035 cycle
- Momentum for just transition and tech sharing
Way Forward
- Strengthen FIs: Global Green Bank or reformed MDBs for concessional climate finance.
- Technology transfer: TRIPS waiver for critical green tech.
- Capacity building: For adaptation, data systems, and local resilience.
- Accountability mechanisms: Binding MRV (Monitoring, Reporting, Verification).
- Integrated approach: Climate + biodiversity + SDGs alignment.
Conclusion
COP30 at Belém represents a make-or-break moment for the Paris Agreement.
It must:
- Convert ambition into action,
- Turn finance into justice, and
- Ensure transition without exclusion.
For India, the challenge is to balance growth and green obligations, while leading the developing world towards an equitable climate future.
India’s first Indoor Air Quality (IAQ) scale
Why in News ?
- A research team from BITS Pilani Hyderabad’s MMNE Lab, led by Prof. Sankar Ganesh and Dr. Arun Roy Choudhury, has developed India’s first customised Indoor Air Quality (IAQ) scale.
- The device aims to measure key indoor air pollutants and assign a numerical score, similar to the outdoor Air Quality Index (AQI), to assess indoor air safety.
- The findings were published in the Royal Society of Chemistry journal, highlighting the urgent need to include indoor air standards in building codes and smart cities.
Relevance:
GS 3 – Environment, Science & Technology, Health
• Indoor air pollution and public health impacts
• Innovation in environmental monitoring (AI-based sensor models)
• Air quality standards and smart city integration
• Sustainable urban development and building codes
• Linkages to SDG 3 (Health) & SDG 11 (Sustainable Cities)
Background
- While outdoor air pollution gets wide attention, indoor air can be 2–10 times more polluted, according to WHO and environmental studies.
- Urban India’s closed, poorly ventilated environments worsen the situation, especially in winters.
- Currently, India lacks a standardised Indoor AQI framework, unlike the US, UK, and EU which already have IAQ norms.
What is the Indoor Air Quality (IAQ) Scale?
- A quantitative index similar to the outdoor AQI but designed for indoor environments such as homes, offices, and classrooms.
- Developed through AI-based modelling considering:
- Pollutant concentration (59.5%)
- Exposure time (25.9%)
- Ventilation efficiency (9.8%)
- Enclosure size (4.4%)
- Generates a score from 22 to 100, with 22 being the most severe and 100 the best quality.
Major Indoor Pollutants Identified
| Pollutant | Source | Health Impact |
| Benzene | Paints, solvents, cleaning agents, fuels | Carcinogenic; damages blood and immune system |
| Carbon monoxide (CO) | Incomplete combustion (stoves, incense) | Reduces oxygen supply; causes headaches, fatigue |
| PM2.5 and PM10 | Dust, cooking smoke, building materials | Respiratory and cardiovascular diseases |
| Volatile Organic Compounds (VOCs) | Paints, furniture, cleaning agents | Neurological and hormonal impacts |
| Methane | Organic waste decay | Potent greenhouse gas; affects indoor oxygen levels |
Key Findings
- Indoor PM2.5 and PM10 levels can exceed outdoor safe limits due to poor ventilation and frequent cooking/cleaning.
- Seasonal fluctuations: Winter months show higher toxicity as households remain closed.
- Benzene emerged as India’s most dangerous indoor pollutant, linked to cancer and birth defects.
- Carbon monoxide levels rise due to incense burning and disinfectant misuse.
- Construction materials and poor ventilation amplify pollution accumulation indoors.
India’s First Indoor AQI Model — How It Differs from Air Purifiers
- Air purifiers only detect particulate matter and humidity.
- IAQ scale measures multiple pollutant categories (PM, CO, VOCs, Benzene, etc.), exposure time, and ventilation data.
- Offers context-specific measurement for India’s dense housing, varied climates, and mixed pollution sources.
- Meant for public use once commercialised — IP registration is in process.
Why Indoor Air Quality Matters ?
- WHO estimates >3.2 million annual deaths globally due to household air pollution.
- India: Over 700,000 deaths annually linked to indoor air pollution (IHME, 2023).
- Vulnerable groups: Children, elderly, pregnant women, and those with pre-existing respiratory issues.
Health Impacts
- Short-term: Headaches, dizziness, fatigue, irritation of eyes/nose/throat.
- Long-term:
- Respiratory diseases (asthma, COPD, bronchitis)
- Cardiovascular ailments
- Neurological disorders (due to VOCs and benzene exposure)
- Cancers linked to chronic exposure to benzene and formaldehyde.
Major Sources of Indoor Pollution
- Cooking and heating using biomass, charcoal, or kerosene.
- Cleaning products, disinfectants, synthetic fragrances.
- Construction dust, paints, and adhesives.
- Tobacco smoke and vehicle emissions entering from outdoors.
- Poor waste management, causing methane accumulation indoors.
What Can Households Do?
- Improve cross ventilation and use exhaust fans.
- Avoid synthetic air fresheners; use natural cleaning agents.
- Segregate and compost organic waste.
- Introduce indoor greenery (e.g., money plant, areca palm).
- Prefer low-VOC paints and avoid excessive incense burning.
Policy and Research Implications
- Inclusion of IAQ standards in National Building Code and Smart City guidelines.
- Integrate IAQ sensors in urban monitoring networks.
- Incentivise eco-friendly building materials and natural ventilation designs.
- Promote public awareness through government campaigns.
- Encourage research and innovation under ‘Make in India for Health’ and National Clean Air Programme (NCAP).
Broader Context and Global Best Practices
- U.S. EPA and EU use detailed IAQ indices covering 10+ pollutants.
- Singapore mandates indoor air audits in public buildings.
- China links IAQ norms with green building certification.
- India’s new IAQ framework could align with SDG 3 (Health) and SDG 11 (Sustainable Cities).
Conclusion
- The BITS Hyderabad Indoor AQI scale is a pathbreaking initiative bridging a critical policy gap.
- With India urbanising rapidly, indoor air quality will define public health outcomes as much as outdoor pollution.
- The next step lies in national adoption, standardisation, and citizen-level awareness to ensure every home breathes clean air.
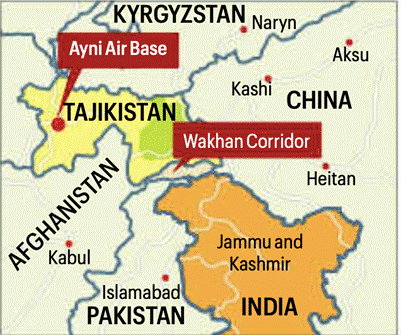
Story of India’s withdrawal from overseas airbase in Tajikistan
Why in News ?
- India has withdrawn its military personnel and equipment from the Ayni airbase near Dushanbe, Tajikistan — its only overseas military base — after two decades of operation.
- This marks the end of India’s physical military presence in Central Asia, which had strategic implications for Afghanistan, Pakistan, and China.
Relevance:
GS 2 – International Relations
• India–Central Asia strategic cooperation and geopolitical shifts
• Balancing influence vis-à-vis China and Russia
• Impact on India’s extended neighbourhood policy
• Bilateral relations with Tajikistan and regional security architecture
GS 3 – Defence & Security
• Strategic infrastructure and overseas military logistics
• Shift towards maritime security and Indo-Pacific focus
• Defence diplomacy, counterterrorism, and regional connectivity
Background: Development of the Base
- Origin: Built during the Soviet era, the base was in poor condition after the USSR’s collapse.
- India’s Involvement:
- India began deploying military personnel in the late 1990s, assisting the Northern Alliance in Afghanistan against the Taliban.
- In 2002, India signed an agreement with Tajikistan for joint use and invested ~$80 million in renovation.
- Agencies Involved: Border Roads Organisation (BRO) handled infrastructure; Indian Air Force stationed personnel, including Su-30MKI jets.
- The base was used during humanitarian evacuations when Taliban regained control in 2021.
Strategic Significance of the Ayni Airbase
- Geographic location: ~20 km from Afghanistan’s Wakhan Corridor, which touches Pakistan-occupied Kashmir (PoK) and China’s Xinjiang province.
- Resources & Access: Tajikistan is resource-rich (uranium, gas, gold) and offers access to Central Asia, making it critical for India’s regional outreach.
- Counterbalance: Provided India a strategic foothold near Afghanistan and counterweight to China–Pakistan axis in the region.
Reasons for Withdrawal
- Reluctance of Tajikistan to renew the 2002agreement, reportedly due to:
- Increasing Chinese and Russian influence in Tajikistan.
- Tajikistan’s balancing act between India, China, and Russia.
- Geopolitical Shifts:
- U.S. withdrawal from Afghanistan (2021) reduced immediate need for proximity operations.
- Taliban’s return changed the regional security calculus.
- Operational Constraints:
- Lack of permanent control; the base remained under Tajik authority.
- Logistical challenges in maintaining supplies and operations from India.
- Cost and Strategic Recalibration:
- India may have prioritized naval expansion and maritime partnerships (e.g., Agalega, Mauritius) over continental bases.
Potential Impact
- Reduced Central Asian Footprint:
Weakens India’s direct military presence in Central Asia, an area crucial for connectivity (INSTC, Chabahar) and counterterrorism coordination. - Geopolitical Vacuum:
Opens more space for China (Belt and Road, military bases) and Russia to strengthen influence. - Loss of Strategic Leverage:
Ayni had given India symbolic parity with major powers like the US and Russia, both having regional bases.
India’s Alternate Overseas Military Presence
- Agalega (Mauritius):
India and Mauritius inaugurated an airstrip and jetty on the island; enhances surveillance over Western Indian Ocean. - Other Facilities:
- Bhutan: Indian Military Training Team (IMTRAT).
- Rashtriya Rifles and RBG (Royal Bodyguard) training in Bhutan.
- Naval outreach through coastal radar chains and logistics agreements with friendly nations (e.g., France, Oman).
Broader Strategic Context
- China’s Expansion:
- Has a military base in Djibouti and is reportedly exploring a base in Tajikistan (though unacknowledged).
- Over 100 military facilities globally.
- India’s Strategic Shift:
Moving focus from continental strategy (Afghanistan-Central Asia) to maritime strategy (Indian Ocean) — aligning with Indo-Pacific outlook.
Conclusion
- India’s withdrawal from the Ayni airbase marks a strategic retreat from Central Asia, reducing its direct military footprint in a geopolitically vital region bordering Afghanistan, China, and Pakistan.
- The move reflects Tajikistan’s growing alignment with Russia and China, limiting India’s operational autonomy despite its early investments and regional aspirations.
- It underscores a strategic shift in India’s defence posture — from seeking continental presence in Central Asia to strengthening maritime and Indo-Pacific partnerships for broader power projection.


