Why in News?
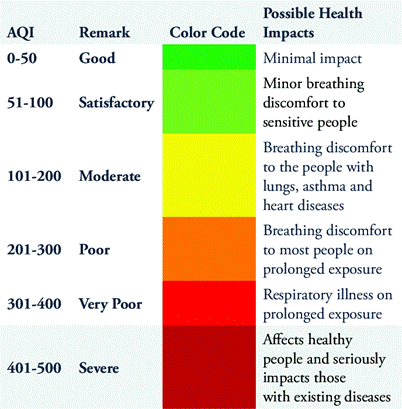
- Delhi recorded severe air pollution with AQI over 400 on November 12, 2025, prompting public protests.
- Recent environmental studies and disasters, including acid rain trends, glacial lake floods in Uttarkashi, and Cyclone Montha impacts, highlight the growing threat of climate-induced extremes.
- Climate attribution science is increasingly used to link local events to global warming, raising both scientific and policy implications.
Relevance:
- GS 3: Environment & Ecology — climate change attribution, extreme events, disaster-linked pollution.
- GS 3: Disaster Management — GLOFs, cyclone intensification, early warning systems.
- GS 3: Pollution Control — acid rain trends, urban AQI crisis, point vs non-point source emissions.
Background:
- Air Pollution in Delhi:
- Contributing factors: vehicle emissions, crop residue burning in neighbouring states, Diwali firecrackers, seasonal wind patterns.
- Health impacts: respiratory ailments, cardiovascular stress, public protests highlighting citizen concern.
- Acid Rain:
- Studies (IMD & IITM, Pune) show increasing acidity in rainwater over three decades.
- Local examples: Visakhapatnam (fossil fuel and port emissions), Dhanbad (coal mining emissions, chemical reactions forming secondary pollutants).
- Glacial Lake Outburst Floods (GLOFs):
- Uttarkashi flash floods (2025) reminiscent of 2013 Kedarnath disaster.
- Cause: glacier melt, climate change influencing intensity of rainfall and snow melt.
- Cyclone Intensification:
- Cyclone Montha (October 2025) impacted Andhra Pradesh, with warming seas increasing moisture and storm intensity.
Climate Attribution Science:
- Purpose: Estimates how human-induced climate change alters frequency, intensity, and probability of extreme events.
- Methodology:
- Models simulate the world without anthropogenic greenhouse gases and compare to observed events.
- Attribution more accurate for heat waves than extreme rainfall or floods.
- Uses satellite observations, chemical transport modelling, and historical trends.
- Examples:
- Kedarnath floods: increased June rainfall linked to rising greenhouse gases and aerosols.
- Acid rain: linked to specific point sources (power plants, industrial clusters).
Key Observations:
- Point vs Non-Point Sources:
- Point sources: concentrated emissions (e.g., power plants).
- Non-point sources: dispersed emissions (vehicles, agriculture).
- Global vs Local Responsibility:
- India’s cumulative CO2 since 1850 <6%.
- Developed nations bear larger historical responsibility for climate change.
- Legal and Economic Implications:
- Advances in climate economics and attribution raise the possibility of climate litigation against major fossil fuel companies.
- Potential for monetary/injunctive relief for climate-induced damages.
Policy and Strategic Implications:
- Urban Air Quality Management:
- Strengthen monitoring, regulate vehicular emissions, manage seasonal crop burning.
- Disaster Preparedness:
- Early warning systems for GLOFs and cyclones.
- Community awareness and climate-resilient infrastructure.
- Energy Transition:
- Continue expansion of solar, wind, and battery storage to reduce future emissions.
- Climate Justice:
- Developed countries may need to compensate developing nations for historical emissions.
- Research & Modelling:
- Improve climate models for better event attribution, particularly for rainfall and flood events.


