Content
- Is the End of Progress Against Extreme Poverty Approaching?
- Pan Masala Cess and Higher Duties on Tobacco Products
- Why India Needs Bioremediation
- Can India Become Self-Reliant in Rare Earth Elements (REEs)?
- Sanchar Saathi App Mandate by DoT
- Rising GPS Spoofing Incidents Near Indian Airports
- Rare Earth Permanent Magnets (REPMs).
- Why Pollution Affects North Indian Cities More Than South & West
Is it the end of progress against extreme poverty?
What Is Extreme Poverty?
- Defined by the World Bank as living on less than $2.15/day (2017 PPP).
- Core indicators: lack of food security, no access to sanitation, healthcare, electricity, education.
- Used globally to measure SDG-1 implementation.
Relevance
GS 1 – Society
- Global poverty trends, demographic transitions.
- Regional disparities (Asia vs Africa).
- Social indicators: education, health, inequality.
GS 2 – International Relations / Social Justice
- SDG-1, SDG-10 performance.
- Role of institutions (World Bank, IMF, UN).
- Governance gaps in fragile states.
GS 3 – Economy
- Growth–poverty elasticity.
- Structural transformation, employment, productivity.
- Climate vulnerability and conflict economics.
- Global poverty projections and economic stagnation in Africa.
What Has Happened Since 1990? (Global Background)
- 1990: 2.3 billion people in extreme poverty.
- 2024: Decline by 1.5 billion, one of the largest improvements in human history.
- Drivers:
- Rapid Asian growth (China, Indonesia, India, Bangladesh).
- Structural transformation (manufacturing, urbanisation).
- Trade integration.
Why Rapid Decline Is Slowing Now
- In the 1990s, most poor people lived in fast-growing Asian economies.
- Today, most extremely poor live in stagnating African economies (Madagascar, DR Congo, Malawi, Mozambique, Burundi, CAR).
- GDP per capita in these countries has not grown for decades.
Projections (World Bank + IMF)
A. Up to 2030
- Extreme poor decline from 831 million (2025) to 793 million (2030).
- Decline modest; nowhere close to earlier pace.
B. After 2030
- Reversal begins: number starts rising due to:
- Stagnant African economies
- High fertility
- Climate vulnerability
- Weak state capacity
C. Geographic shift
- 1990: Most poor in Asia.
- 2024–2040: Majority in Sub-Saharan Africa.
Why Progress Is Stalling ?
- Economic stagnation in core African states (per capita income same as 1950 in Madagascar).
- Mean incomes below poverty line → redistribution alone cannot eliminate poverty.
- Population growth outpacing economic growth.
- Climate shocks and conflicts.
- Weak human capital: low productivity, poor education, poor health.
How Latin American Countries Fit Into This Picture (Panama, Bolivia, Mexico, Brazil)
A. Mexico
- Middle-income country with moderate poverty reduction.
- Extreme poverty dropped significantly 1990–2015; stagnated thereafter.
- Drivers:
- Manufacturing-based growth (NAFTA)
- Social transfer programmes (Oportunidades)
- Challenges:
- Regional disparity (South vs North)
- Crime, informality
- Slow post-2015 GDP growth
B. Brazil
- Major decline in extreme poverty 2003–2014 (Bolsa Família, commodity boom).
- Recent stagnation due to:
- Political instability
- Low productivity
- Commodity cycle downturn
- Still far ahead of Africa; baseline poverty much lower.
C. Panama
- One of Latin America’s fastest-growing economies; extreme poverty declined sharply (Canal services, logistics).
- Challenges:
- High inequality
- Indigenous-region poverty pockets remain.
D. Bolivia
- Poverty reduction since 2005 due to:
- Hydrocarbon boom
- Cash transfer schemes
- But growth slowdown post-2014 → stagnation.
- Still better trajectory than African stagnators but not Asian-style high growth.
Overall Latin America Trend
- No stagnation as deep as Africa, but insufficient growth to replicate Asian-style poverty elimination.
- Inequality a persistent drag across region.
Chart Logic Explained (Charts 1A–1D & Chart 2)
Charts 1A & 1B (High-growth Asian countries)
- China, Indonesia, India, Bangladesh → large initial poverty shares (>60%)
- Rapid GDP/capita rise → large decline (<10%).
Charts 1C (Latin America – e.g., Mexico, Brazil, Bolivia, Panama)
- Lower initial extreme poverty.
- Reduction is slower because:
- Growth moderate, not explosive.
- Inequality high.
- Poverty is more structural, less mass-extreme.
Charts 1D (African stagnators)
- DR Congo, Malawi, Burundi, CAR, Mozambique
- GDP/capita stagnant for decades.
- Extreme poverty remains >50%.
Chart 2 (Projections to 2040)
- Shows a break from past trend:
- Decline until 2030
- Rise afterward
- Latin America stays low-extreme-poverty but not driving global reduction.
- Asia essentially exits extreme poverty.
- Africa drives global numbers upward.
Key Insight: Redistribution vs Growth
- Countries like Madagascar, DR Congo:
- Mean income < poverty line
- Even perfect redistribution keeps everyone poor
- Only sustained GDP growth can eliminate extreme poverty.
Why Future Looks Different From Past
- Earlier gains came from countries that were poor but grew rapidly.
- Now most extremely poor live in countries with:
- Very low state capacity
- Fragile institutions
- Climate vulnerability
- Conflict
- Weak human capital
- Without structural transformation, the poverty trap deepens.
Implications for SDGs
- SDG-1 (End Poverty by 2030) will not be met.
- SDG-10 (Inequality) becoming more central.
- Africa becomes global development priority.
Policy Lessons
- Growth-first strategy essential in low-income countries.
- Need strong investment in:
- Education
- Health
- Agricultural productivity
- Climate resilience
- Governance reforms
- Redistribution works only after basic growth begins.
PAN MASALA CESS & HIGHER DUTIES ON TOBACCO PRODUCTS
Why Is This in News?
- The Union Government introduced two new Bills in Parliament:
- Health Security Cess Bill, 2025
- Central Excise (Amendment) Bill, 2025
- Objective: Replace the soon-ending GST Compensation Cess on tobacco with new revenue streams and bring pan masala manufacture under tighter fiscal regulation.
- Context: GST compensation cess on tobacco to discontinue after repayment of COVID-era borrowings.
Relevance
GS 2 – Governance / Polity
- Fiscal federalism: Centre–State financial relations.
- Legislative process (Bills introduced in Parliament).
- Public health as a State subject; non-shareable cess debate.
GS 3 – Economy / Public Health
- Pigouvian taxes.
- Sin goods taxation and behavioural economics.
- Revenue mobilisation post-GST cess sunset.
- Illicit trade, compliance, machine-based excise monitoring.
Basics
- GST Compensation Cess (2017–present)
- Levied on sin goods: tobacco, aerated drinks, coal, pan masala, etc.
- Purpose: Compensate States for revenue loss due to GST rollout.
- Compensation tenure: 5 years (2017–2022), extended to repay loans taken during COVID years due to shortfall.
- Tobacco & pan masala: High-elasticity sin goods used for revenue + public health control.
Key Features of the New Bills
A. Health Security Cess Bill, 2025
- Introduces a new cess on tobacco products.
- Purpose:
- Replace GST compensation cess as it sunsets.
- Generate earmarked funds for health and national security.
- Target of levy:
- Machines installed or processes undertaken in pan masala and similar harmful product manufacturing.
B. Central Excise (Amendment) Bill, 2025
- Enhances excise duty on tobacco products.
- Reconfigures the tax framework to ensure:
- Continuous revenue after GST compensation cess ends.
- Stabilisation of the tax base for sin goods.
Rationale Behind the Move
Fiscal Rationale
- GST compensation cess on tobacco is ending, but:
- COVID-era borrowings still being repaid.
- Tobacco is a high-yield, low-compliance-elasticity sector:
- Ensures steady revenue.
- Pan masala sector has high evasion risk:
- Machine-based cess improves traceability and compliance.
Public Health Rationale
- Tobacco-related deaths in India: ~1.3 million annually.
- Pan masala very high in carcinogens (areca nut).
- Higher taxes = reduced affordability, especially among youth.
Governance Rationale
- Machine-based cess on pan masala aligns with:
- FMCG excise surveillance model (packaging line tracking).
- Anti-evasion efforts used earlier (pre-GST) under the Pan Masala Packing Machines Rules.
Economic & Policy Implications
For Centre–State Fiscal Dynamics
- Signals the final drawdown of GST compensation.
- States lose a predictable revenue stream; Centre creates a new central cess (non-shareable with States).
For Industry
- Higher duties raise production costs for:
- Cigarettes
- Chewing tobacco
- Pan masala
- Likely impacts:
- Increased MRP
- Reduced consumption
- Pushback from industry lobbies
For Public Health
- WHO recommends a minimum 75% tax share in retail price of tobacco.
- India’s effective burden still < 60% for many tobacco forms.
- New cess + increased excise brings India closer to global health norms.
For GST Architecture
- Marks a shift from compensation cess to purpose-specific cesses.
- Raises debate on:
- Fragmenting GST into multiple cesses.
- Compliance burden on industries.
- Fiscal federalism concerns.
Political & Parliamentary Context
- Bills introduced amid Opposition sloganeering on unrelated political issues.
- Winter Session traditionally used for major tax reforms.
- Lok Sabha simultaneously passed the Manipur GST Amendment Bill, reflecting a focussed GST reform push.
Challenges & Criticisms
- States may resent loss of compensation-related certainty.
- Health cess not shared with States despite health being a State subject.
- Risk of increasing illegal/unregulated tobacco trade.
- Pan masala manufacturers may shift to unregistered, small units to evade machine-based cess.
Value Addition (Data + Concepts)
- India is second-largest tobacco consumer globally.
- Economic cost of tobacco use: 1% of GDP (ICMR estimate).
- Sin taxes follow Pigouvian taxation principles.
Why does India need bioremediation?
Why Is It in News?
- Rising concern over pollution load from human waste, untreated sewage, industrial effluents, oil spills, and heavy metals.
- Rivers such as Ganga and Yamuna continue to receive untreated discharges despite improvements.
- Government and scientific bodies pushing bioremediation as a scalable, low-cost, sustainable alternative to traditional clean-up technologies.
- India evaluating national standards, biosafety norms, and GM microbe regulation to support bioremediation expansion.
- Growing interest as part of Swachh Bharat, Namami Gange, Clean Technology Programme, and global green technology trends.
Relevance
GS 1 – Geography / Environment
- Soil degradation, river pollution, land contamination.
- Environmental hotspots (Ganga, Yamuna, mining belts).
GS 2 – Governance
- Regulatory gaps: biosafety norms, GM microbe rules.
- Centre–State urban waste management responsibilities.
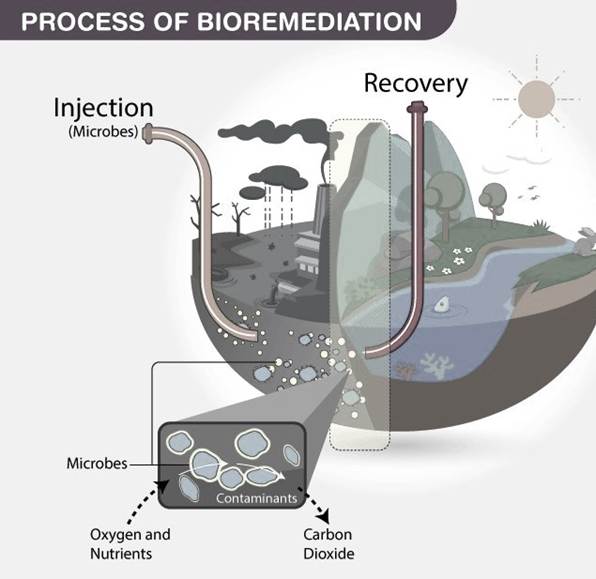
What Is Bioremediation?
- Use of microorganisms (bacteria, fungi, algae), plants, or microbial enzymes to degrade, detoxify, or immobilise pollutants.
- Converts toxic substances (oil, pesticides, plastics, heavy metals) into harmless by-products like CO₂, water, organic acids.
- Works through microbial metabolism where pollutants become energy or nutrient sources.
Types of Bioremediation
- In situ: Treatment at the contaminated site
- Oil-eating bacteria sprayed on ocean spills
- Bioventing, biosparging for soil
- Ex situ: Contaminated material removed and treated elsewhere
- Bioreactors, biopiles, land farming
- Modern versions:
- GM microbes designed to tackle plastics, hydrocarbons, persistent organic pollutants
- Nanobioremediation combining nanomaterials with microbes
Why Does India Need Bioremediation?
- Severe pollution burden
- Ganga and Yamuna receive large volumes of untreated sewage
- Industrial hotspots contaminated with heavy metals, hydrocarbons, solvents
- Traditional methods costly
- Physico-chemical methods generate secondary waste, require high energy
- Bioremediation advantages
- Cheaper, scalable, energy-efficient
- Utilises India’s microbial biodiversity
- Ideal for diffuse, large-area contamination
- Environment–health concerns
- Oil leaks, pesticide residues, endocrine disruptors
- Contaminated soil reducing agricultural productivity
- Rural–urban waste surge
- Landfills (e.g., Mittanaganahalli, Bengaluru) facing persistent organic loads
Where India Stands ?
- Research ecosystem increasing
- DBT’s Clean Technology Programme
- NEERI’s mandate for bioremediation solutions
- IITs developing novel materials (cotton nanocomposite for oil spills)
- Indigenous bacteria identified to break down pesticides, dyes, hydrocarbons
- Growing industry participation
- BCIL, Econirmal Biotech offering microbial formulations
- Gaps
- Fragmented standards
- Limited site-specific microbial data
- Pollutants often mixed and complex
- Regulatory ambiguity on GM organisms
- Limited trained personnel
International Experience
- Japan
- Integrates plant-microbe systems into municipal waste treatment
- Bioremediation used to restore urban brownfields
- European Union
- Cross-country collaborations for oil spill clean-up
- Microbial mining waste restoration under Horizon programmes
- China
- Bioremediation embedded in soil pollution control laws
- Genetically improved bacteria used to restore industrial wastelands
- Global Trend
- Shift towards biotechnology-driven environmental restoration
- Increased use of GM microbes with strict biosafety layers
Opportunities for India
- River restoration: Yamuna, Ganga, Damodar, Musi
- Land reclamation: mining-affected areas, landfill remediation
- Industrial clean-up: petrochemical zones, tanneries, textile clusters
- Job creation: biotechnology, environmental engineering, monitoring
- Integration with national missions: Swachh Bharat, Namami Gange, waste-to-wealth
Key Risks
- GM organisms in open environments
- Potential for unintended ecological shifts
- Risk of horizontal gene transfer
- Inadequate testing/oversight
- New problems can emerge if microbes behave unpredictably
- Public distrust
- Misconceptions around GM microbes
- Regulatory gaps
- Need new biosafety guidelines
- Certification and monitoring systems insufficient
What India Should Do Next ?
- Develop national standards
- Protocols for microbial applications
- Testing, certification, and monitoring frameworks
- Establish regional bioremediation hubs
- Universities–industry–local govt partnerships
- Region-specific microbial libraries
- Public engagement
- Awareness campaigns to build trust
- Community participation in river and soil clean-up
- Expand R&D
- Indigenous GM strains adapted to Indian conditions
- Nanobioremediation for persistent pollutants
- Strengthen biosafety regulation
- Clear rules for environmental release of GM microbes
Can India become self-reliant in REE production?
Why is it in News?
- Union Cabinet approved a ₹7,280-crore scheme to establish integrated REPM manufacturing facilities in India.
- Aim: Convert rare earth oxides → metals → alloys → permanent magnets, reducing import dependence.
- Announcement comes as China tightens export controls on rare earth elements (REEs) and magnets, disrupting global supply chains.
Relevance
GS 1 – Geography
- Mineral distribution in India (monazite sands: TN, Kerala, Odisha).
- Resource geography and strategic minerals.
GS 2 – International Relations
- Strategic minerals in geopolitics (US–China tech war).
- Global supply chain dependencies.
- Critical minerals alliances with Japan, US, EU.
GS 3 – Science & Tech
- Metallurgy, magnet technology, refining and separation tech.
- REPM (NdFeB) magnet ecosystem.
What are Rare Earth Elements (REEs)?
- Group of 17 elements: 15 lanthanides + Scandium + Yttrium.
- Properties: High magnetic strength, heat resistance, conductivity.
- Applications:
- EV motors
- Wind turbine generators
- Electronics and semiconductors
- Defence systems (missiles, radars, avionics)
- Smartphones, hard drives
- REEs are relatively abundant, but extraction is costly, energy-intensive, and polluting.
China’s Dominance: Extent and Strategy
- 70% of global production, 90% of global processing, but only 30% of known reserves.
- Controls entire value chain: mining → processing → magnet manufacturing.
- Tools of dominance:
- 2009: Export quotas → struck down by WTO in 2015.
- 2020: Restricted graphite exports.
- 2021: Export licensing to control downstream industries.
- 2024-25: Export restrictions on 7 rare earths and finished magnets.
- Impact on industries:
- EV makers worst affected, followed by electronics & defence.
- Part of broader US–China trade and tech war.
Why India is Prioritising REEs?
- REEs are critical for:
- Electric mobility (EV motors = NdFeB magnets)
- Renewables (wind turbines)
- Electronics manufacturing
- Defence and space systems
- India’s situation:
- Imports 53,000+ MT of REE magnets (FY 2024-25).
- Holds ~8% of global REE reserves, mainly monazite sands (TN, Kerala, Odisha, Andhra).
- Produces less than 1% of global REEs.
Government Moves Toward Self-Reliance
New ₹7,280-crore REPM scheme
- Supports end-to-end magnet manufacturing.
- Aim: Create India’s first complete rare-earth magnet supply chain.
National Critical Mineral Mission (2024–2031)
- Total outlay: ₹34,300 crore (₹16,300 crore approved Jan 2024).
- Focus areas:
- Exploration
- Processing
- Refining
- Recycling (end-of-life electronics)
Mining reforms
- Private sector allowed entry since August 2023.
- Auctions of REE-rich blocks in progress.
Structural Challenges for India
- Refining and separation infrastructure absent (core of China’s strength).
- Skill gaps in metallurgy, material sciences, precision magnet making.
- Regulatory hurdles: environmental approvals, slow exploration licensing.
- Long gestation period: 5–8 years for full supply chain maturation.
Opportunities India Can Leverage
- Large monazite deposits rich in Neodymium (Nd) → essential for permanent magnets.
- Growing ecosystem of magnet recycling from e-waste.
- Global diversification push away from China → aligns with India’s manufacturing ambitions.
- Strategic potential:
- Reduce dependence in EVs, defence, electronics.
- Build partnerships with Japan, US, EU (who are all seeking non-China REE suppliers).
Strategic Significance
- Economic dimension
- Reduces import bill for magnets & REEs.
- Boosts Make in India for EVs, electronics, renewables.
- High-value segment: REPMs (NdFeB magnets) are 10x more valuable than raw REE oxides.
- Geopolitical dimension
- Counters China’s resource weaponisation tactics.
- Strengthens India’s role in global critical minerals alliances (Indo-Pacific partnerships).
- Security dimension
- Defence systems—from missile guidance to electronic warfare—depend on REPMs.
- Reducing vulnerability enhances strategic autonomy.
- Environmental dimension
- Domestic production necessitates safe mining + environmentally sound refining.
- Recycling can reduce pollution and import dependence simultaneously.
Conclusion
- REEs are indispensable for modern technology; China dominates supply chains.
- India has reserves but lacks extraction–processing–magnet manufacturing capacities.
- The ₹7,280-cr scheme + National Critical Minerals Mission aim to build self-reliance.
- Success depends on deregulation, infrastructure, skilled workforce, and global collaboration.
Sanchar Saathi app must be pre-installed on phones: DoT
Why is it in News?
- Department of Telecommunications (DoT) has ordered all smartphone manufacturers to pre-install the Sanchar Saathi app on devices sold from March 2026.
- Manufacturers must ensure the app cannot be disabled or restricted.
- Move follows rising concerns about IMEI tampering, SIM misuse, cross-border digital frauds, and second-hand phone black markets.
Relevance
GS 2 – Governance
- Regulatory power of DoT.
- Device-level regulation, digital governance.
- Privacy vs security debate.
- Mandatory pre-installation and consumer rights.
GS 3 – Internal Security / Cybersecurity
- IMEI tampering, SIM fraud, digital impersonation scams.
- CEIR integration for stolen device tracking.
- Telecom security architecture strengthening.
What is Sanchar Saathi?
- Launched in 2023 as a portal; later developed into a mobile app.
- Provides services via CEIR (Central Equipment Identity Register).
- Core functions:
- Check mobile connections issued in your name.
- Report scam calls, financial fraud attempts.
- Identify and report IMEI tampering.
- Block, track, and remotely disable stolen/lost devices.
- Prevent re-activation of stolen phones using new SIMs.
What Has the Government Ordered Now?
- Mandatory pre-installation of Sanchar Saathi on all phones sold after March 2026.
- Manufacturers must ensure no disabling, no removal, and no restriction of functions.
- Objective:
- Verify authenticity of IMEIs.
- Prevent second-hand market fraud, resale of stolen/blacklisted phones.
- Curb scam calls, cross-border digital fraud operations.
Why This Mandate? Rising Telecom Security Threats
IMEI tampering
- Single IMEI used simultaneously on multiple devices.
- Makes legal action, tracing, and blacklisting difficult.
Cross-border digital fraud
- Fraudsters use Indian numbers abroad even after the original SIM is removed.
- Enables government impersonation scams, “digital arrest” frauds, UPI extortion attempts.
Second-hand smartphone black market
- India has one of the world’s biggest used-phone markets.
- Stolen/blacklisted phones resold → buyers unknowingly become legal abettors.
Cybercrime explosion
- Over 2.48 lakh complaints on Sanchar Saathi.
- Over 2.9 crore requests to check mobile connections linked to users.
- In October alone, 50,000 lost/stolen devices recovered via the app.
Technical Layer: IMEI Authentication Push
- Device IMEI must match the one registered on the telecom network.
- Sanchar Saathi + CEIR enables:
- Real-time detection of tampered/spoofed IMEI.
- Auto-blocking of cloned devices.
- Permanent blacklisting of stolen phones.
What About Privacy Concerns?
- DoT claims:
- The app collects no user data (as per Google Play declaration).
- Only helps verify IMEI and SIM-linkage.
- However:
- Pre-installation without option to disable → risk of perceived surveillance.
- Unclear whether the app will auto-access IMEI or require manual input.
- Past concerns:
- Apple earlier resisted mandatory pre-installed TRAI DND app due to permissions (access to SMS/call logs).
Industry Reaction & Global Context
- Smartphone makers typically resist government-mandated apps.
- Apple has protested similar mandates in India before.
- Internationally, tech firms resist “bloatware” and privacy-sensitive pre-loads.
- The 2026 mandate may cause:
- Industrial pushback
- Negotiations on permissions
- Possible technical challenges for foreign OEMs
Governance & Regulatory Perspective
DoT’s rationale
- SIM-binding + IMEI-verification essential to:
- Eliminate anonymous numbers.
- Reduce cross-border scam ecosystems.
- Improve national telecom security architecture.
Target outcome
- Unified system connecting device (IMEI), SIM, user identity, and operator’s network.
- A core element of India’s cyber-fraud prevention strategy.
Benefits Expected
- Reduced resale of stolen phones.
- Faster recovery of lost devices.
- Curbing large-scale OTP, UPI, and impersonation scams.
- Greater transparency in second-hand sales.
- Strengthened digital public infrastructure security.
Challenges Ahead
- Manufacturer resistance (Android & iOS).
- Potential privacy debates.
- Usability issues if app requires repeated verification.
- Risk of government overreach perception.
- Ensuring app does not become a surveillance pipeline.
Overall Significance
- Strengthens India’s telecom cybersecurity ecosystem.
- Part of the trend toward device-level and SIM-level regulation.
- Linked to larger frameworks:
- CEIR
- Digital India
- National Cyber Security Strategy (pending)
- Shows government’s increasing focus on fraud prevention and digital trust
Rising GPS Spoofing Incidents Near Indian Airports
Why is is in News?
- Multiple instances of GPS spoofing and GNSS (Global Navigation Satellite System) interference have been reported near major Indian airports.
- Delhi airport saw repeated spoofing incidents, with similar reports from Kolkata, Amritsar, Mumbai, Hyderabad, Bengaluru, Chennai.
- Ministry of Civil Aviation informed Parliament that the Wireless Monitoring Organisation (WMO) has been directed to identify the source of interference/spoofing.
- These incidents pose a serious aviation safety risk, prompting DGCA and AAI to mandate reporting of any such events.
Relevance
GS 1 – Geography
- GNSS systems (GPS, GLONASS, Galileo, BeiDou).
- Satellite signal vulnerabilities in dense airspace.
GS 2 – Governance / IR
- Civil aviation regulation by DGCA, AAI.
- Cross-border interference and geopolitical angle.
GS 3 – Internal Security / Cybersecurity
- Electronic warfare, jamming, spoofing.
- Aviation cyber risks and national security.
- Protection of critical infrastructure.

What is GPS Spoofing?
- GPS spoofing = broadcasting fake GPS signals stronger than the real satellite signals.
- Aircraft navigation systems may lock onto counterfeit coordinates, causing incorrect:
- Position
- Altitude
- Speed
- Flight path
- Creates dangerous navigation deviations, especially during approach and landing.
What is GNSS Interference?
- GNSS = GPS + other satellite systems (GLONASS, Galileo, BeiDou).
- Interference includes:
- Jamming: blocking signal reception.
- Spoofing: altering positional data.
- Both severely impact aviation safety, particularly in low-visibility or conflict zones.
What’s Happening in India?
- Delhi airport reported multiple GPS spoofing events, especially near Runway 10.
- Fake signals appear during approach and landing, when precision is critical.
- Other airports (Kolkata, Mumbai, Bengaluru, Hyderabad, Chennai, Amritsar) also reported similar patterns.
- November saw unusually high number of events around IGI Airport.
Why is This Dangerous?
Direct risks
- Incorrect aircraft position → flight deviations.
- Confusion between runways/flight paths.
- Possible near-miss or runway excursions.
- Overreliance on GNSS makes aircraft vulnerable.
Indirect risks
- Increased pilot workload.
- Potential exploitation by cyber actors during geopolitical tensions.
- Compromised ATC situational awareness.
Government & Regulatory Response
DGCA
- Made reporting of spoofing mandatory since 2023.
- Working with AAI to enhance detection networks.
AAI
- Monitoring interference near Delhi and other airports.
- Engaging with WMO to trace source.
DoT/WMO
- Mobilised resources to locate approximate spoofing location.
- Investigating signal strength, direction, timestamps.
Airlines & Pilots
- Instructed to report incidents immediately.
- Asked to maintain heightened situational vigilance.
Possible Sources of Spoofing (Experts’ View)
- Rogue personal or commercial jammers.
- Cross-border interference drift.
- Criminal networks using spoofers for evasion.
- Malicious cyber actors (ransomware/malware targeting aviation infrastructure).
- Faulty or misconfigured commercial GNSS repeaters.
No official source has been identified yet.
Global Context
- GPS spoofing has risen worldwide:
- Middle East conflict zones
- Russia–Ukraine war
- China and South-East Asia maritime regions
- Civil aviation globally is increasingly vulnerable.
- ICAO has warned of “GNSS-denied environments” becoming common in geopolitically sensitive areas.
Why India is More Vulnerable ?
- High-density aviation routes.
- Heavily GNSS-dependent landing procedures (RNP/GLS).
- Growing electronic warfare capabilities in neighbourhood.
- Widespread availability of cheap spoofers online.
Technical & Security Measures Needed
- Deploy GNSS interference monitoring stations around airports.
- Integrate RAIM, SBAS, and inertial navigation fallback systems.
- Combine radar + ADS-B + multilateration for redundancy.
- Strict DoT controls on illegal RF devices.
- Cybersecurity upgrades across airports and ATC.
Rare Earth Permanent Magnets (REPMs).
Why is it in News?
- The Union Cabinet has approved a ₹7,280-crore scheme to promote domestic manufacturing of Rare Earth Permanent Magnets (REPMs).
- The scheme aims to set up integrated facilities that convert rare earth oxides → metals → alloys → finished magnets, reducing India’s overwhelming dependence on Chinese imports.
- This comes amid China’s continued control over global REE supply chains, periodic export restrictions, and rising global demand from EVs, wind energy, electronics, robotics, defence.
Relevance
GS-3: Economy & Infrastructure
- Critical minerals
- Strategic industries
- Import substitution
GS-3: Science & Technology
- Advanced materials
- Metallurgy
- Magnetic technologies
GS-2: International Relations
- Supply-chain resilience
- India–China trade dependencies
- Quad critical mineral collaboration
What are Rare Earth Elements (REEs)?
- A group of 17 elements including lanthanides + scandium + yttrium.
- Known for:
- High magnetic strength
- High melting point
- Excellent conductivity
- REPMs (e.g., Neodymium-Iron-Boron (NdFeB)) are critical to:
- EV motors
- Wind turbines
- Electronics
- Defence systems (missiles, radars)
- Robotics and drones
Why Does India Need REPM Manufacturing Now?
Massive Import Dependence
- India imports nearly all REPMs, especially from China, despite having 8% of global REE reserves.
- In 2024–25 India imported ~53,000 tonnes of REPMs, over 90% from China.
- Domestic REE output is <1% of global production.
Rising Domestic Demand
- Demand projected to rise sharply due to:
- Renewable energy expansion
- EV ecosystem growth
- Defence manufacturing
- Electronics PLI schemes
- Expected consumption to double by 2030.
Strategic Vulnerability
- China controls:
- 70% of REE production
- 90% of global processing and magnet manufacturing
- Has repeatedly restricted exports (2009, 2020, 2023, 2024), hurting global supply chains.
What Does the New ₹7,280-crore REPM Scheme Do?
Key Features
- Supports 6,000 MT annual REPM production capacity (MT/PA).
- Five beneficiaries to be chosen through competitive bidding.
- Will offer:
- Capex support up to ₹6,450 crore
- 75% subsidy for setting up integrated REPM facilities
- Focus on integrated operations, i.e., processing from oxides → metals → alloys → magnets within India.
Outcome Sought
- Reduce Chinese import dependence.
- Build domestic supply chains for EVs, defence, renewable energy.
- Upgrade India’s metallurgical and materials-science ecosystem.
India’s Current Position
Strengths
- Strong monazite reserves (Andhra Pradesh, Odisha, Tamil Nadu, Kerala).
- Indian Rare Earths Ltd (IREL) produces some oxides (Nd, Pr, Dy).
- Growing private sector interest in magnet recycling.
Weaknesses
- No large-scale REPM manufacturing capacity.
- Refining, metallisation and alloying infrastructure is minimal.
- High entry-barriers:
- Cost of plant
- Technical know-how
- Skilled manpower
- Tight global intellectual property ecosystem
- China’s aggressive pricing makes competition very difficult.
The China Factor
How China Built Dominance
- State-supported mining, refining, and manufacturing.
- Integrated supply chains linking mining → oxides → metals → alloys → magnets.
- Low-cost production + subsidies.
- Heavy rare-earth technologies tightly controlled.
China’s Leverage
- REEs used as a geopolitical tool—export controls imposed during trade tensions with:
- U.S.
- Japan
- Taiwan
- Europe
- Magnets are central to China’s grip on EVs, electronics, and defence manufacturing.
How India Plans to Bridge the Gap ?
Domestic Initiatives
- National Critical Mineral Mission (2024).
- Funding for exploration and mineral mapping.
- Mining block auctions (lithium, REEs).
- Magnet recycling initiatives (urban mining).
- Collaboration with Japan, Australia, U.S. on critical minerals.
Required Steps for Self-Reliance
- Build refining and metallisation capacity.
- Incentivise private players and joint ventures.
- Increase IREL capacity + technology partnerships.
- Create a full supply chain reducing foreign dependence.
Challenges Ahead
- High cost vs China’s subsidised pricing.
- Environmental concerns in mining/refining.
- Technological complexity in magnet production.
- Long gestation periods for mines (7–10 years).
- Need for advanced materials-science R&D and IP development.
Why Pollution Affects North Indian Cities More Than South & West
Why is it in News?
- A new analysis by Climate Trends (2025) covering 15 major Indian cities (2015–2025) finds:
- No city recorded safe air quality (AQI < 50).
- Delhi remains the most polluted city across 10 years.
- Pollution shows a regional pattern: north India worst, south-west relatively better.
- Persistent high PM levels in north; annual best AQI in Chennai & Mumbai.
Relevance
GS 1: Urbanisation
- Urban heat island effect
- Population density and air quality impact
GS 2: Governance
- Air quality governance gaps
- NCR states’ coordination failures
GS 3: Environment
- AQI trends
- Climate–pollution interactions
- Geographic determinants of pollution
- Winter inversion, Indo-Gangetic Plain dynamics
What is AQI & Why It Matters?
- Air Quality Index (AQI) categorises air quality from 0–500:
- 0–50: Good
- 51–100: Satisfactory
- 101–200: Moderate
- 201–300: Poor
- 301–400: Very Poor
- 401–500: Severe
- The study uses annual mean AQI—a more reliable long-term pollution indicator than daily spikes.
Overall Air Quality Performance
- Delhi’s annual mean AQI:
- Highest in 2016 (over 250)
- Slight improvement after 2019
- Still remains in poor–very poor category
- In 2025 (so far):
- Delhi AQI ~180–190
- Lucknow, Varanasi, Ahmedabad, Pune: also experienced prolonged poor AQ levels
North Indian Cities Perform the Worst
- Six cities—Delhi, Lucknow, Varanasi, Kanpur, Noida, Ghaziabad—consistently show high PM2.5 & AQI deterioration, especially winter.
- Annual best AQI never enters “good” or even “satisfactory” range.
South & West Indian Cities Perform Better
- Chennai, Bengaluru, Mumbai, Visakhapatnam show:
- Better mean AQI levels (120–140 range)
- More stable improvement post-2019
- But they still fall short of clean air standards.
City-Level Variations
- Chennai & Mumbai: best annual quality among all 15 cities
- Bengaluru: did not record safe annual AQI even once but still far cleaner than north
- Chandigarh, Visakhapatnam, Mumbai saw AQI improvements from 800 → 140 days of good-moderate air.
Why North Is More Polluted: Geographic & Climatic Factors
1. Indo-Gangetic Plain Topography
- North India is landlocked, unlike coastal south/west.
- Bordered by the Himalayas in the north, preventing dispersion of pollutants.
- Creates a “pollution bowl” where PM2.5 gets trapped.
2. Winter Inversion + Cold, Dry Air
- Winter causes thermal (temperature) inversion:
- The layer of warm air sits above cold air near the surface
- Acts as a lid, trapping pollutants
- Result: Smog, stagnation, prolonged pollution episodes.
3. Dust Load + Biomass Burning
- Indo-Gangetic belt has heavy soil dust, crop residue burning, brick kilns, industrial clusters.
4. Weak Wind Speeds
- North experiences slow winds in winter; lack of sea breezes.
- This reduces pollutant flushing.
Why South & West Perform Better ?
- Coastal cities (Chennai, Mumbai):
- Sea breeze circulation disperses pollutants
- Higher humidity and cleaner marine air reduce dust
- Less temperature inversion
- Fewer winter smog events
- Lesser biomass burning and lower dust aerosol load
Structural Factors Adding to North’s Problem
- Dense urban structure → “surface roughness” that slows wind dispersion
- High vehicle density
- More industrial clusters
- High secondary aerosol formation in winter


