Content
- How India has managed to weave ‘RCEP minus China’
- Twenty-first century solutions to snake bites
- Health for All vs Ground Reality
- Venezuela’s resource curse
- What are rare-earth elements and why is everyone looking for them
- Alaknanda: Indian astronomers spot implausibly old spiral galaxy
- PM Calls for State-Level PRAGATI Replication and Data Strategy Units
How India has managed to weave ‘RCEP minus China’
Why in news ?
- India and New Zealand concluded negotiations on a bilateral Free Trade Agreement (FTA) in Dec 2024–25, while India continues to stay out of the Regional Comprehensive Economic Partnership (RCEP).
- The development is being framed as a “RCEP-minus-China” strategy — i.e., signing bilateral/mini-lateral FTAs with RCEP members (except China) to secure market access without exposing India to China-centric risks embedded in RCEP.
Relevance
- GS-II (International Relations, India & Regional Groupings)
- India’s trade diplomacy, strategic autonomy, China-plus-one supply chains
- GS-III (Economy – External Sector, Trade Policy, Industry Competitiveness)
- FTAs, tariff safeguards, MSME vulnerability, manufacturing competitiveness
RCEP in brief
- World’s largest trade bloc at launch (ASEAN-10 + China, Japan, South Korea, Australia, New Zealand).
- Covers ~30% of global GDP and trade, aims at tariff reduction, rules-of-origin integration, services and investment harmonisation.
- India withdrew in 2019 citing concerns of:
- Surge in cheap imports, especially from China
- Weak safeguards on dumping and non-tariff barriers
- Unresolved issues in services, e-commerce, data and market access
- Risk of deindustrialisation and farm distress.
India’s stated concerns
- Large and persistent trade deficit with China (India’s biggest bilateral deficit partner).
- RCEP tariff cuts could have created near-zero duty access for Chinese goods through partner-country routing (“indirect entry”).
- Lack of strong auto-trigger safeguards, strict rules of origin, and effective dispute enforcement.
- Agriculture, MSMEs, dairy and light manufacturing flagged as high-vulnerability sectors.
What India is doing instead — ‘RCEP minus China’ ?
- Strategic choice: bilateral FTAs with most RCEP members while keeping China outside any tariff-cut framework.
- India already concluded or upgraded trade pacts with:
- Australia (ECTA, 2022 → CEP upgrade under way)
- UAE (CEPA, 2022)
- Mauritius CECPA
- Ongoing talks / frameworks with Japan, Korea (upgrades), ASEAN review, UK, EU, Gulf region
- New Zealand FTA (2024–25 conclusion announced).
- Objective: secure market access + investment + supply-chain links
while avoiding tariff dependence on China.
Why this strategy matters ?
- Market access without surrendering tariff control to China → lowers systemic risk.
- Selective integration helps India promote:
- Manufacturing competitiveness & PLI-led sectors
- Services mobility & digital trade bargaining power
- Trusted-supply-chain partnerships (Indo-Pacific, IPEF-style).
- Reduces exposure to price under-cutting and import surges in steel, electronics, chemicals, toys, textiles, tyres, dairy etc.
India–New Zealand FTA
- Expands access in agri-products, processed food, tourism, education, services.
- Sensitive areas (e.g., dairy) handled with calibrated concessions / exclusions.
- Complements earlier FTAs with Australia and ASEAN, improving Indo-Pacific economic connectivity.
Comparative assessment: Joining RCEP vs ‘Minus-China’ path
- RCEP (with China) — Risks
- High probability of import diversion via ASEAN hubs
- Weak leverage on non-tariff barriers
- Tariff erosion before domestic industry becomes competitive.
- Bilateral path — Advantages
- Negotiation flexibility (sector-wise safeguards, staging, quotas)
- Policy space for industrial upgrading
- Targeted reciprocity tied to domestic priorities.
Critiques & Constraints
- Fragmented bilateralism may create complex rules-of-origin and compliance costs.
- Lost opportunity to shape regional standards architecture from inside RCEP.
- India must still address domestic productivity gaps, logistics costs, scale & technology depth to fully utilise FTAs.
Strategic implications
- Supports China-plus-one diversification and resilient supply chains.
- Aligns with Indo-Pacific economic coalitions while preserving autonomy.
- Positions India as a selective liberaliser prioritising security-sensitive sectors.
Data-linked takeaway indicators
- RCEP bloc ~30% of world GDP / population; largest mega-FTA at inception.
- India exited in Nov 2019; cited unresolved safeguards and market-access asymmetries.
- India’s largest trade deficit partner = China; vulnerability concentrated in manufacturing value chains.
- India pursuing FTA-led market access with most RCEP members except China (“RCEP-minus-China”).
Twenty-first century solutions to snake bites
Why in news ?
- New research (Nature, 2025) has demonstrated progress toward a broad-spectrum, next-generation antivenom using camelid-derived nanobodies — a potential shift away from India’s six-decade-old horse-serum–based antivenom model.
- Parallel Indian work (NRC on Camel, Bikaner) shows camel-antivenom efficacy against Sochurek’s saw-scaled viper, signalling scope for region-specific, modern antivenom platforms.
- The issue is critical because snakebite remains a major public-health burden in rural India, despite medical advances.
Relevance
- GS-II (Health, Governance of Public Health Systems)
- Neglected tropical diseases, rural health inequity, service delivery gaps
- GS-III (Science & Technology, Biotechnology & Public Health Innovation)
- Nanobody-based antivenom, translational research, Make-in-India biologics
Scale of the problem
- India records ~58,000 snakebite deaths annually (Lancet estimates), with highest mortality in Uttar Pradesh, Bihar, Jharkhand, Madhya Pradesh, Rajasthan.
- Deaths primarily affect farm workers, paddy cultivators, and rural households — a classic neglected tropical disease (NTD) (WHO classification).
- Case-fatality worsens due to late referral, inadequate antivenom availability, poor transport, lack of trained rural health staff, and regional venom variation.
Basics — venom, species and clinical effects
- Three major toxic effects of venoms
- Haemotoxic → bleeding, clotting failure (common in vipers)
- Neurotoxic → respiratory / muscle paralysis (typical in cobras & kraits)
- Cytotoxic → local tissue necrosis, disability/amputations
- India’s medically important species (“Big Four”)
- Spectacled cobra, common krait, Russell’s viper, saw-scaled viper
- Problem: India has >60 venomous species and strong geographical venom variation → current antivenom often mismatched.
Conventional antivenom — process & limitations
- Venom from the Big Four is injected into horses → repeated immunisation → antibodies harvested from plasma → purified, freeze-dried, supplied in vials.
- Limitations
- Designed for Big Four only; poor coverage for other species / regional variants
- Batch variability, high cost, cold-chain dependence
- Adverse reactions (serum sickness, anaphylaxis) due to heterologous horse proteins
- Requires multiple vials and ICU support → increases mortality in peripheral settings.
Twenty-first-century approach — nanobody / recombinant technology
- Camelid family (camels, llamas, alpacas) produce unique single-domain antibodies (“nanobodies”)
- Small, stable, heat-tolerant, highly specific, easier to mass-produce in bacteria
- Research workflow (Danish–international collaboration, Africa focus)
- Venoms of 18 medically important species collected
- Injected into alpaca & llama → strong immune response
- B-cells isolated → nanobody genes cloned into bacteriophage vectors
- High-affinity binders selected → recombinant nanobodies manufactured
- Animal trials showed protection against 17 of 18 venoms tested
- Indian progress
- NRC-Camel (Bikaner) demonstrated camel-derived antivenom neutralisation for Sochurek’s saw-scaled viper (Rajasthan region) → pathway for region-specific platforms.
Why this matters for India ?— policy & health relevance
- Potential for broad-spectrum, pan-regional antivenom reducing:
- Mortality & amputations
- Dose requirements & adverse reactions
- Cost and dependence on horse-serum collection
- Supports WHO’s Snakebite Envenoming Roadmap (2030) — targets 50% reduction in deaths and disabilities.
- Aligns with India’s priorities: rural health equity, indigenous biotech, Make-in-India biologics, cold-chain-light therapeutics.
Challenges going forward
- Translational gap — moving from lab success to clinical trials, regulatory approval, GMP manufacturing.
- Need species-wise & geography-wise validation for India’s venom diversity.
- Supply-chain planning (district hospitals, PHCs), training for early administration, and public awareness against harmful first-aid practices.
- Sustained investment in surveillance, toxinomics databases, and regional venom banks.
Way ahead — actionable priorities
- Expand Indian nanobody platforms beyond pilot species; build national venom biobank + genomic / proteomic mapping.
- Develop region-calibrated antivenom portfolios (Deccan, Indo-Gangetic, Western Ghats, Arid zones).
- Integrate rapid diagnostics, ambulance referral networks, and standardised treatment protocols in rural health systems.
- Public-health messaging on boots, torches, field safety, and immediate hospitalisation.
Health for All vs Ground Reality
Why in news ?
- India’s “Health for All” agenda faces serious stress points in 2024–25—funding gaps after U.S. withdrawal from WHO programmes, widening AMR (antimicrobial resistance) burden, missed targets on TB elimination, and repeated pharma quality failures linked to contaminated cough syrups.
- With a population of 146 crore, rising NCDs, climate-linked illnesses, resurgent infections, and weak regulatory enforcement make universal health coverage a difficult—but urgent—goal.
Relevance
- GS-II (Issues relating to Health, Welfare Schemes, Regulation)
- UHC gaps, AMR crisis, TB elimination shortfalls, pharma-quality regulation
- GS-III (Economy – Budgeting & Public Expenditure, Health Economics)
- Low health spending, fiscal prioritisation, donor-funding shocks
India’s health challenges — facts & evidence
- AMR burden (WHO-GLASS 2025)
- 1 in 3 Indians with bacterial infections carry drug-resistant organisms (vs 1 in 6 globally).
- High resistance in E. coli, Klebsiella pneumoniae, Staphylococcus aureus — especially in ICUs.
- Drivers: OTC antibiotic sales, self-medication, incomplete courses, environmental contamination, livestock misuse, weak regulation.
- Kerala is the only State showing decline in AMR due to stewardship + surveillance + prescription control.
- Resurgent infectious diseases
- Rising incidence of TB, dengue, influenza-like illnesses, and climate-linked vector diseases.
- Multidrug-resistant (MDR/XDR) TB growing despite diagnostics expansion.
- Non-communicable diseases
- Cardiovascular diseases, diabetes, cancers, mental-health disorders continue to drive >60% of mortality (IHME estimates).
- Air-quality & climate risks
- Severe urban air pollution → respiratory & cardiovascular morbidity, productivity loss; weak multi-sectoral mitigation.
Funding deficit — what changed and why it matters ?
- External funding shock (2025)
- U.S. exit from WHO → funding cuts to PEPFAR, USAID health initiatives affecting HIV/AIDS, population services, maternal-child health in India.
- Govt reported $97 million committed across 7 projects, but broader programme pipelines faced uncertainty → States had to backfill gaps.
- Budgetary constraints
- Union health outlay ₹99,859 crore (2025-26) — ~11% rise, but still < 2% of GDP (target in National Health Policy = 2.5% of GDP).
- Persistent under-investment → infrastructure shortages, skewed urban concentration of care, weak primary health systems.
Why AMR is a cause for worry (public-health and economic risk)
- Leads to higher mortality, longer hospital stays, ICU overload, and expensive last-line drugs.
- Threatens success of surgery, cancer therapy, maternal care, and TB control.
- Environmental AMR pathways (pharmaceutical effluents, hospital wastewater, poultry/aquaculture) remain poorly regulated.
- National Action Plan on AMR (Phase-II) needs uniform State-level stewardship, lab networks, prescription audits, antibiotic procurement controls.
Why India missed the TB elimination goal?
- Structural gaps
- High household transmission, under-nutrition, overcrowding, delayed diagnosis in remote areas.
- Private-sector under-notification, irregular treatment adherence, socio-economic vulnerabilities.
- Programmatic progress (but insufficient)
- Wider deployment of TrueNat molecular tests, faster detection + drug-resistance mapping.
- Newer regimens introduced, but MDR/XDR TB burden rising, requiring longer, costlier, toxic therapies.
- Lesson: Diagnostics alone cannot offset deficits in nutrition support, contact tracing, adherence monitoring, social protection, urban housing & migration health policies.
Pharma-quality failures — why they are alarming ?
- Recent tragedies
- 25 child deaths in Madhya Pradesh due to cough syrup containing diethylene glycol (DEG).
- Earlier incidents (e.g., 70 child deaths in The Gambia) linked to Indian-made syrups exposed systemic lapses.
- Systemic weaknesses
- Fragmented State-level licensing, uneven lab capacity, inadequate batch testing & traceability, limited post-marketing surveillance.
- Global reputation risk to India’s “pharmacy of the world” ambition; threatens exports and domestic patient safety.
- Regulatory priorities
- Centralised risk-based inspections, mandatory GMP 2.0, stronger API & excipient quality chains, product recall systems, and criminal liability for falsified drugs.
Is ‘Health for All’ on track? — Balanced assessment
- Strengths
- Expanded diagnostics & beds post-COVID, digital health initiatives, insurance coverage growth, supply-side reforms in select States.
- Gaps
- Low public spending, workforce shortages at PHCs/CHCs, uneven State capacity, weak surveillance, AMR surge, quality-control lapses, climate-health inattention.
- Bottom line
- Without higher public investment + regulation + primary-care centric reforms, the campaign risks stagnation.
What India needs to do ?— policy way forward
- Financing
- Raise public health outlay to ≥2.5% of GDP; prioritise primary care, district hospitals, epidemiology, labs; ring-fence funds for AMR & TB.
- AMR control
- Nationwide stewardship programmes, prescription audits, ban OTC antibiotic sales, regulate industrial effluents, expand GLASS-aligned labs.
- TB strategy
- Intensify nutritional support, contact tracing, community DOT, migrant coverage, private-sector integration, shorter MDR regimens where evidence permits.
- Pharma quality
- Nationalised quality grid, lot-level testing, bar-code traceability, recall & whistle-blower mechanisms, capacity building of State regulators.
- Climate & air-quality health actions
- Health-sector engagement in clean-air missions, heat-action plans, surveillance for climate-sensitive diseases.
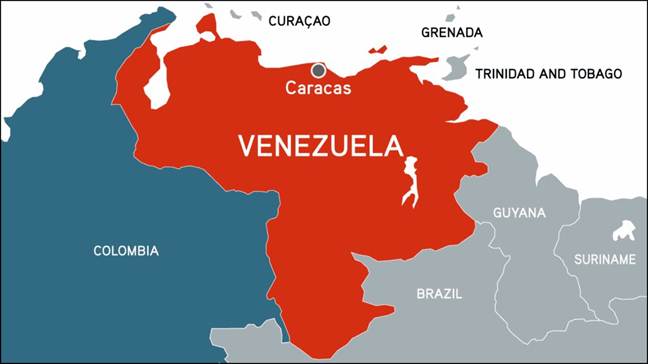
Venezuela’s resource curse
Why in news ?
- The U.S. has escalated pressure on Venezuela through a naval blockade and oil “quarantine”, tightening sanctions on the country’s petroleum exports.
- This development has revived debate on Venezuela’s “resource curse” — how a nation with the world’s largest proven crude reserves (~303 billion barrels, 2023) ended up with economic collapse, institutional erosion, and declining oil output.
Relevance
- GS-II (International Affairs, Global Economic Developments)
- Sanctions politics, oil geopolitics, humanitarian-economic crises
- GS-III (Economy – Resource Dependence, Fiscal Vulnerability)
- Dutch Disease, SOE governance, diversification failure, debt stress
Basics — what is the “resource curse”?
- A paradox where resource-rich countries experience slower growth, weaker institutions, debt crises, corruption, and economic volatility instead of prosperity.
- Core mechanisms:
- Over-dependence on a single commodity
- Dutch Disease (currency appreciation → industrial decline)
- Rent-seeking & political capture
- Boom-bust cycles linked to global prices
- Under-investment in human capital & diversification
Venezuela’s oil economy — structure & vulnerabilities
- Largest global proven crude reserves: ~303 bn barrels (2023) — but mostly extra-heavy crude needing advanced extraction tech + costly diluents + complex refining.
- Production–capacity gap
- Output in 2024 ≈ 0.92 million barrels/day → ~56% lower than 1980s levels.
- Aging infrastructure, frequent shutdowns, and skills drain.
- State oil firm PDVSA
- Operates five domestic refineries
- Hit by chronic under-investment, mismanagement, politicisation
- Post-2002 strike & purges → bureaucratisation, loss of technical leadership.
From boom to bust — economic trajectory with data
- 1970s boom: Oil price surge during the Yom Kippur War → Venezuela reached Latin America’s highest per-capita income; but growth was unequal and consumption-led.
- Post-2014 downturn + sanctions era
- Oil price collapse + governance failures → GDP per capita fell back to early-1990s levels — a sharper decline than any peer country in the same period.
- Public debt: Highest general-government gross debt among OPEC members despite large reserves — signalling structural, not just price-cycle, distress.
Role of U.S. sanctions — scale & effects
- 2017: Financial-market access restrictions.
- 2019: Direct sanctions on PDVSA — froze U.S. assets, blocked payments for exports, restricted supply of diluents essential for extra-heavy crude.
- 2023: Temporary easing → later reversed; new naval blockade / oil quarantine under Trump’s second presidency.
- Effects:
- Financing collapse, equipment shortages, loss of foreign partners
- Logistics & export bottlenecks, discount pricing, shrinking market access
- Accelerated production decline & fiscal stress.
- However, the crisis cannot be attributed to sanctions alone — internal mismanagement remains central.
Internal drivers of the resource curse
- Over-dependence on oil exports
- Minimal diversification compared to many OPEC peers → non-oil exports stagnated (Chart 4 in article).
- Institutional weakening
- Centralised political control over PDVSA finances → soft budget discipline, rent distribution, corruption risks.
- Human-capital erosion & capital flight
- Skilled engineers exited; maintenance & safety systems deteriorated.
- Macroeconomic instability
- Oil-linked revenue shocks → hyperinflation, currency collapse, poverty spikes.
Trade position collapse — export share evidence
- Venezuela’s share of global crude exports:
- >4% in the 1990s (second only to Saudi Arabia)
- ≈0.35% in 2023 — reflecting capacity loss + sanctions + infrastructure decline (Chart 5).
Why other OPEC states fared better ?
- Greater fiscal buffers & sovereign funds, diversification to petrochemicals / services / logistics, stronger state capacity, and counter-cyclical policies.
- Venezuela lacked: institutional insulation of oil revenues, professionalised SOE management, and long-term capability investment.
Current situation — risks and socio-economic fallout
- Output stagnation, shrinking public revenues
- Debt overhang, limited refinancing options
- Humanitarian strain — migration, unemployment, declining public services
- Geopolitical exposure as energy becomes a sanctions-leveraged asset.
Way forward — structural reforms
- Stabilise PDVSA: Professional management, ring-fenced capex, transparency, JV partnerships with technology transfer.
- Diversify the economy: Agro-industry, light manufacturing, services; build export-competitiveness beyond oil.
- Revenue-management rules: Sovereign wealth fund, counter-cyclical spending, strict audit trails.
- Human-capital & infrastructure revival: Skilled workforce retention, refinery modernisation, safety & maintenance regimes.
- Sanctions diplomacy & phased reintegration to unlock technology and capital while safeguarding institutional reforms.
What are rare-earth elements and why is everyone looking for them?
Why in news ?
- Rare-earth elements (REEs) have re-emerged as a strategic resource in the clean-energy and electronics economy, owing to their central role in permanent magnets, EV motors, wind turbines, defence systems, lasers, catalysts, and advanced optics.
- Global competition has intensified as China dominates mid-stream refining and magnet manufacturing, while other countries — including India, Japan, the U.S., Australia, and Vietnam — are scrambling to secure supply chains, expand refining capability, and reduce import dependence.
Relevance
- GS-III (Science & Tech, Economy – Critical Minerals & Strategic Industries)
- Green-tech supply chains, magnet industry, refining bottlenecks
- GS-II / IR
- Strategic resources, China-centric dependency, techno-geopolitics
Basics — What are rare-earth elements?
- Chemically, the term refers to 17 metallic elements:
- 15 lanthanides (La → Lu) plus scandium (Sc) and yttrium (Y).
- They are not truly rare geologically — but are dispersed in low concentrations, often occurring together in the same minerals, making separation technologically difficult and expensive.
- Historical terminology
- “Earths” = early chemistry term for oxide powders from which metals couldn’t be easily isolated → hence “rare–earths”.
- Sometimes confused with other “critical minerals” such as lithium, cobalt, gallium, germanium — but these are not REEs.
Why rare-earths matter — technology & applications (evidence-based) ?
- Permanent magnets (core strategic use)
- Nd-Fe-B magnets (neodymium-iron-boron) → EV motors, wind turbine generators, robotics, drones, HDDs, defence systems.
- Dysprosium & terbium → thermal stability in high-temperature magnets.
- Phosphors & optics
- Europium, terbium in display phosphors; neodymium, erbium in lasers & fibre-optics.
- Catalysts, ceramics, polishing, speciality glass
- Automotive catalytic converters, refining catalysts, precision glass finishing.
- Why they work (science insight)
- Localised 4f-electrons → strong magnetic moments + magnetocrystalline anisotropy → high magnet strength & stability even at heat/speed.
Global distribution — reserves & strategic geography
- World rare-earth-oxide equivalent reserves: >90 million tonnes (approx.).
- China – 44 MT
- Brazil – 21 MT
- India – 6.9 MT
- Australia – 5.7 MT
- Russia – 3.8 MT
- Vietnam – 3.5 MT
- U.S. – 1.9 MT
- Greenland – 1.5 MT
(Scandium typically excluded from these reserve estimates.)
Why mining is not enough — the ‘midstream bottleneck’ ?
- REEs occur in minerals such as bastnäsite, monazite, ion-adsorption clays.
- Steps in the value chain:
- Beneficiation → crushing, grinding, flotation / gravity to obtain concentrate
- Cracking → strong acids/bases or heat to break minerals
- Leaching → dissolve REEs into solution as ions
- Separation (hardest step) → solvent extraction with hundreds of stages to split chemically-similar +3 ions
- Precipitation → oxide powders (transport/storage form)
- Reduction → metals (if required for magnets/alloys)
- Environmental & safety risks:
- Thorium/uranium co-occurrence → radioactive waste
- Acid/alkali effluents → hazardous waste treatment imperative.
Why refining is strategic ?
- Oil can be separated efficiently by fractional distillation due to differing boiling points.
- REEs require chemically discriminating, energy-intensive separation because their ions behave almost identically → high cost, long processing chains.
- Factories require precise oxide/metal composition & purity — no easy substitution between elements (unlike interchangeable crude grades).
China’s dominance — data and implications
- According to the International Energy Agency (IEA):
- ~91% of global rare-earth separation & refining capacity is in China.
- ~94% of sintered RE permanent-magnet production occurs in China.
- Many countries hold deposits but depend on China for midstream processing and magnets → strategic vulnerability for EVs, wind energy, electronics & defence.
Emerging global responses
- Japan (2026 plan) → deep-sea mud extraction near Minamitori Island (≈6 km depth) to diversify long-term supply.
- U.S., EU, Australia, India, Vietnam → policies to build refining, magnet-making & recycling capacity, not just mining approvals.
- Increasing focus on circular economy REE recovery from e-waste, motors, turbine magnets.
India — opportunities & challenges
- 6.9 MT reserves, especially monazite-rich beach sands (Thorium co-presence → regulatory caution).
- Policy priorities:
- Build domestic separation & magnet manufacturing ecosystems
- Encourage JV technology partnerships + environmental safeguards
- Invest in R&D for solvent-extraction efficiency & alternative magnet chemistries
- Develop strategic stockpiles & recycling pipelines.
Key conceptual takeaways
- Rare-earths are geologically abundant but technologically scarce.
- Value & power lie in the midstream separation + magnet industry, not merely in mining.
- They are critical enablers of green-tech transitions and emerging-tech defence systems.
- China’s refining dominance = supply-chain leverage → global diversification efforts accelerating.
Alaknanda: Indian astronomers spot implausibly old spiral galaxy

Why in news ?
- Indian astronomers using James Webb Space Telescope (JWST) data from the UNCOVER survey have identified Alaknanda — the second-farthest known spiral galaxy, observed at z ≈ 4 (≈ 1.5 billion years after the Big Bang).
- The galaxy shows two highly symmetric spiral arms, a stellar disk, and a compact bulge — a level of morphological maturity far earlier than current galaxy-formation models predict. The findings were published in Astronomy & Astrophysics (2025).
Relevance
- GS-III (Science & Technology – Space, Astronomy & Research)
- JWST observations, early-universe galaxy formation, Indian science capability
- GS-II / Science Diplomacy
- Global collaborations, big-science participation
Basics — what makes the discovery extraordinary
- Spiral galaxies typically require long-lived, rotationally supported disks and stable density-wave structures → believed to form several billion years after the Big Bang.
- Simulations rarely produce well-structured spirals at z ~ 4 → Alaknanda challenges prevailing models of disk settling, stellar feedback, and merger histories.
- Photometric analysis indicates:
- High star-formation rate ≈ 60 M☉/yr (vs Milky Way ≈ 1–2 M☉/yr)
- Distinct spiral contrast preserved even after disk–bulge light subtraction → confirms genuine structural arms, not imaging artifacts.
How it was detected — methods & validation
- Researchers analysed ~70,000 objects in JWST data to study early-universe morphologies.
- Disk + bulge decomposition → spiral arms remained visible after smooth-light removal.
- Three independent photometric-redshift estimates → consistent z-value, stellar mass & formation history.
- Experts recommend follow-up spectroscopy (JWST IFU / ALMA) to:
- verify kinematics & gas dynamics
- rule out clumpy alignments or tidal features
- distinguish between growth vs interaction-driven arm formation.
Why Alaknanda is a scientific puzzle ?
- Current models predict:
- early galaxies are clumpy, turbulent, merger-dominated
- disks stabilise later as gas fractions decline.
- What Alaknanda shows:
- ordered spiral geometry + high star-formation rate
- implies rapid disk settling or accelerated structural evolution.
- Galaxy formation here behaves like a complex-systems problem — governed by known physics but multiple interacting processes (gas inflow, feedback, turbulence, angular-momentum transport).
Possible formation pathways
- Cold-flow accretion model
- steady inflow of cold gas → rotationally stable disk
- density-wave instabilities generate spiral arms.
- Minor-merger / interaction trigger
- interaction with a smaller companion → induces two-arm spiral modes.
- Present observations cannot yet discriminate between the two → motivates deeper kinematic mapping.
What JWST enables — technology & capability leap ?
- Long-wavelength sensitivity + high spatial resolution → resolves fine structures in high-z galaxies unreachable with Hubble.
- Helps constrain early-epoch morphology timelines, improving simulations of disk formation, feedback physics, and cosmic structure growth.
Broader implications for galaxy-evolution theory
- Suggests spiral structure may emerge earlier than assumed.
- Indicates some galaxies may achieve rapid dynamical cooling & angular-momentum organisation.
- Encourages refinement in:
- hydrodynamic simulations
- star-formation & feedback prescriptions
- gas inflow and merger-rate modelling.
Significance for Indian astronomy
- Demonstrates high-impact discovery from Indian researchers using global facilities.
- Highlights need for:
- larger astronomy workforce & training programmes
- consistent participation in major surveys & collaborations
- domestic capability building (e.g., 10-m Hanle telescope) alongside SKA, LIGO partnerships.
Limitations & next steps
- Photometric-only evidence → requires spectroscopic confirmation.
- Priority studies:
- JWST IFU spectroscopy → rotation curves, velocity dispersion
- ALMA gas-kinematics mapping → test accretion vs interaction hypothesis
- environmental survey → search for companions / tidal signatures.
Key takeaways
- Alaknanda = mature spiral at z ~ 4, ~1.5 Gyr after Big Bang.
- Symmetric two-arm structure + high SFR (~60 M☉/yr) → indicates early disk maturity.
- Challenges standard timelines of spiral-disk formation; improves constraints on galaxy-evolution physics.
- Discovery underscores JWST’s transformational role and India’s growing research footprint.
PM Calls for State-Level PRAGATI Replication and Data Strategy Units
Why in news ?
- At the Fifth National Conference of Chief Secretaries, the Prime Minister urged States to replicate PRAGATI (Pro-Active Governance and Timely Implementation) at the State level and to set up Data Strategy Units and Deregulation Cells in government offices.
- The push reflects a shift toward technology-led governance, data-driven decision-making, faster project monitoring, and regulatory simplification to improve service delivery and economic competitiveness.
Relevance
- GS-II (Governance, e-Governance, Public Administration & Service Delivery)
- Tech-enabled monitoring, inter-governmental coordination, grievance systems
- GS-II / Reforms in Institutions
- Deregulation cells, Regulatory Impact Assessment, data-driven governance
Basics — What is PRAGATI?
- Launched: 2015 as a digital governance & monitoring platform.
- Nature: Video-conference + GIS + project dashboard integrating data from multiple ministries.
- Objective: Resolve inter-departmental bottlenecks, accelerate public infrastructure & social sector projects, and review grievance redressal.
- Participants: PM, Union Secretaries, Chief Secretaries, State officials.
- Outputs: Time-bound resolution of issues across roads, railways, power, coal, smart cities, housing, irrigation, environment clearances.
Performance indicators :
- Hundreds of projects reviewed across sectors; cumulative investment value in lakh-crore range.
- Focus on public grievance resolution, central-state coordination, and last-mile delivery.
What the PM proposed — key directives to States ?
- Replicate PRAGATI-type platforms in States
- Create State-level dashboards, project review systems, and monthly monitoring headed by CMs/CSs.
- Set up Data Strategy Units (DSUs)
- Build data warehouses, analytics capacity, and policy dashboards for evidence-based governance.
- Create Deregulation Cells in departments
- Identify outdated, redundant, or overlapping regulations; simplify compliance for citizens & businesses.
- Improve regulatory monitoring
- Departments to maintain reform-progress trackers and outcome metrics.
- Reduce time spent on routine meetings; strengthen virtual coordination.
- Encourage ‘Made in India’, quality standards, and logistics-efficiency reforms through better monitoring.
Why this matters — governance and development relevance ?
- Project delays = economic loss (cost overruns, stalled assets, service delivery gaps).
- PRAGATI-type systems cut coordination lags, improve accountability and inter-governmental convergence.
- Data Strategy Units enable:
- targeted welfare delivery, predictive analytics, citizen grievance mapping
- evidence-linked budgeting & policy iteration.
- Deregulation Cells support ease of doing business, reduce compliance burden, and align with Manufacturing, Logistics & Digital Economy goals.
Structural gaps these reforms seek to address
- Fragmented data silos across departments.
- Manual monitoring → limited real-time visibility of project milestones.
- Weak institutional mechanisms for regulatory review & sunset of outdated rules.
- Capacity asymmetry between Union vs State administrative systems.
Implementation challenges
- Data quality, interoperability & privacy safeguards must be ensured.
- Need specialised analytics talent, IT infrastructure, cybersecurity at the State level.
- Avoid dashboard-centric compliance without field-level problem-solving.
- Clear KPIs, grievance outcomes, and citizen-centric metrics required.
- Deregulation must be consultative to avoid dilution of essential safeguards (labour, environment, consumer safety).
Way forward — policy priorities for States
- Establish Chief Secretary–led PRAGATI cells with sectoral war rooms.
- Build State Data Platforms integrating land, health, education, urban, logistics, and welfare datasets.
- Adopt open standards, data-governance frameworks, audit trails, and privacy-by-design.
- Institutionalise Regulatory Impact Assessment (RIA) and annual regulation review cycles.
- Link dashboards to citizen feedback loops and independent evaluation.
- Invest in capacity building (data science, programme management, systems thinking).


