Content
- India’s Progress on Its Climate Targets
- Trump–Greenland Remarks
- Jabarkhet Nature Reserve & Alternative Wildlife Tourism
- Why Silver Prices Surged ~160% in 2025
- Turkman Gate
- Contaminated Water Crisis in Indore & Bhopal
India’s Progress on Climate Targets
Why in News?
- Recent Aravalli judgment revived debate on environmental governance, mining, and climate commitments.
- Over 10 years since India’s climate pledges under the Paris Agreement, prompting evaluation of delivery vs outcomes.
- Updated data on emissions intensity, renewable capacity, and forest carbon sinks (ISFR 2023, CEA projections).
- Relevance to India’s 2070 Net Zero credibility.
Relevance
- GS-3 | Environment & Climate Change
- Paris Agreement commitments, emissions intensity vs absolute emissions
- Renewable energy transition, coal dependence, storage bottlenecks
India’s Climate Commitments (Paris, 2015)
- Reduce emissions intensity of GDP by 33–35% from 2005 levels by 2030.
- Achieve 40% non-fossil power capacity by 2030 (later raised to ~50%).
- Install 175 GW renewables by 2022.
- Create 2.5–3 billion tonnes CO₂e forest carbon sink by 2030.
- Principle: Common but Differentiated Responsibilities (CBDR).
Emissions Intensity: Success with Caveats
- Achievement:
- Emissions intensity reduced by ~36% by 2020 (2005 baseline).
- Target met a decade early.
- Drivers:
- Rapid non-fossil capacity expansion (solar, wind, hydro, nuclear).
- Structural shift towards services & digital economy.
- Efficiency schemes: PAT, UJALA → measurable energy savings.
- Limitation:
- Absolute emissions remain high (~2,959 MtCO₂e in 2020).
- India is the 3rd largest absolute emitter globally.
- Conceptual Issue:
- Partial decoupling: GDP growth > emissions growth.
- Intensity ↓, but emissions ↑ in cement, steel, transport.
Renewable Energy: Capacity–Generation Mismatch
- Headline Success:
- Non-fossil capacity rose from ~29.5% (2015) to ~51.4% (June 2025).
- Solar: ~3 GW (2014) → ~111 GW (2025).
- Ground Reality:
- Renewables contribute only ~22% of electricity generation (2024–25).
- Coal (~240–253 GW) still provides >70% of electricity.
- Reasons:
- Low capacity factors of solar/wind.
- Intermittency and grid integration limits.
- Delays in land acquisition and transmission.
- Targets Missed:
- 175 GW by 2022 not achieved.
- 500 GW by 2030 feasible but execution-heavy.
Storage Deficit: Core Bottleneck
- CEA projection (2029–30): 336 GWh storage needed.
- Actual operational storage (Sept 2025): ~500 MWh.
- Without storage:
- Renewables cannot replace coal baseload.
- Grid stability risks increase.
Forest Carbon Sink: Numbers vs Ecology
- Official Claim:
- Total forest carbon stock: 30.43 billion tonnes CO₂e.
- Additional sink since 2005: ~2.29 billion tonnes.
- Target likely met numerically by 2030.
- Data Issues:
- “Forest cover” includes:
- Plantations, eucalyptus, tea, mango orchards.
- Any land >1 ha with >10% canopy.
- Natural forests vs plantations not differentiated.
- “Forest cover” includes:
- Governance Gaps:
- CAMPA funds (~₹95,000 crore) under-utilised (e.g., Delhi ~23% usage).
- Green India Mission (Revised, 2025) equates plantations with regeneration.
- Climate Stress:
- Warming and water stress reduce actual carbon assimilation despite “greening” signals.
Structural Contradictions Highlighted
- Intensity gains coexist with rising absolute emissions.
- Renewable capacity growth masks coal-centric generation reality.
- Forest targets met administratively, not ecologically.
- Coal phase-down roadmap remains opaque.
The Road Ahead
- Battery & pumped storage scale-up at mission mode.
- Transparent coal transition timetable aligned with 2070 net zero.
- Industrial decarbonisation (steel, cement, transport).
- Forest governance reform: quality, biodiversity, survivability metrics.
- Data transparency: sector-wise, region-wise emissions tracking.
- Stronger Centre–State coordination on grids and land.
Trump–Greenland Remarks
Why in News?
- Donald Trump reportedly re-discussed the idea of purchasing Greenland during internal deliberations.
- The White House clarified:
- No immediate diplomatic proposal.
- Military action ruled out, but strategic discussions ongoing.
- Triggered diplomatic responses from Denmark and European leaders.
- Renewed global focus on Arctic geopolitics amid U.S.–China–Russia competition.
Relevance
- GS-2 | International Relations
- Arctic geopolitics, great power competition (U.S.–China–Russia)
- Sovereignty, self-determination, international law (UN Charter)
- GS-1 | Geography
- Arctic region, climate change impact on polar routes
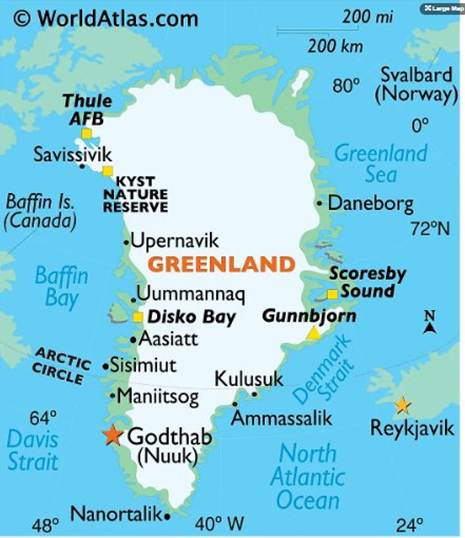
Greenland: Strategic Profile
- Autonomous territory under the Kingdom of Denmark.
- World’s largest island; population ~56,000.
- Located between North Atlantic and Arctic Oceans.
- Hosts a key U.S. military base (Pituffik/Thule Space Base).
Why Greenland Matters Geopolitically ?
Arctic Military Significance
- Controls access to Arctic air and naval routes.
- Critical for:
- Ballistic missile early-warning systems.
- Monitoring Russian Arctic activity.
- Integral to U.S. Arctic defence architecture and NATO security.
Great Power Competition
- Russia:
- Expanding Arctic military bases.
- Northern Sea Route militarisation.
- China:
- Self-declared “near-Arctic state”.
- Investments in mining, infrastructure, and research stations.
- U.S. concern: preventing Chinese strategic foothold in Greenland.
Resource Geopolitics
- Rich in critical minerals:
- Rare Earth Elements (REEs).
- Uranium, zinc, iron ore.
- Minerals essential for:
- Green technologies.
- Defence manufacturing.
- Seen as alternative to China-dominated rare earth supply chains.
Climate Change & Shipping
- Arctic ice melt opening:
- Shorter transcontinental shipping routes.
- New fishing and resource extraction zones.
- Greenland becomes central to future Arctic economic geography.
Diplomatic & Legal Constraints
- Greenland’s leadership and Denmark have rejected any sale.
- Greenland:
- Right to self-determination.
- Increasing push for eventual independence.
- Any transfer would violate:
- Modern international norms.
- Sovereignty principles under UN Charter.
European & NATO Reactions
- Denmark: Firm assertion that Greenland is not for sale.
- European leaders (France, Germany, Italy, Spain):
- Expressed solidarity with Denmark.
- Warned against destabilising Arctic order.
- Issue touches intra-NATO trust and cohesion.
Why This Matters for International Relations ?
- Illustrates:
- Return of territorial geopolitics in a rules-based order.
- Strategic salience of climate-affected regions.
- Highlights:
- Arctic as a new theatre of great power rivalry.
- Tension between strategic realism vs international law.
Takeaway
- The Greenland discussion is not about purchase, but about:
- Strategic denial to rivals.
- Long-term Arctic dominance.
- Reflects how climate change, resources, and security are converging to reshape global geopolitics.
Jabarkhet Nature Reserve (JNR) & Alternative Wildlife Tourism
Why in News?
- Jabarkhet Nature Reserve (JNR) near Mussoorie completed 10 years (2015–2025).
- Highlighted as India’s first privately owned and operated nature reserve with conservation as the primary goal.
- Comes amid:
- Debate on mass tourism vs sustainable tourism in the Himalayas.
- Ecological concerns over road widening, mining, deforestation (Himalayas, Aravallis).
- Offers a distinct third model of wildlife tourism, beyond tiger safaris and restricted national parks.
Relevance
- GS-3 | Environment
- Biodiversity conservation beyond protected areas
- Habitat restoration, landscape-level conservation
What is Jabarkhet Nature Reserve?
- Location: Near Mussoorie, Uttarakhand.
- Area: ~100 acres of restored Himalayan woodland.
- Ownership: Private (Jain family estate), conservation-led management.
- Objective:
- Habitat restoration.
- Wildlife-first access.
- Low-impact, affordable nature tourism.
Ecological Significance
- High biodiversity in a small landscape:
- 150 bird species (e.g. Rufous Sibia, Himalayan griffon vulture).
- Mammals: leopard, goral, barking deer, black bear, civet, porcupine, leopard cat.
- Flora:
- Oaks, deodars, rhododendrons, walnuts.
- 40 fern species.
- Ground orchids, sundews (insectivorous plants).
- Hundreds of fungi, grasses, >300 flowering plants.
- Acts as a refuge and stepping-stone habitat in a fragmented Himalayan landscape.
Alternative Model of Wildlife Tourism
Dominant Models in India
- Safari-based tourism:
- Tiger reserves, gypsy safaris.
- Crowding around “star species”.
- Guided community trails:
- Niche, expert-driven, species-specific.
JNR’s “Third Model”
- Self-paced walking trails.
- Wildlife has first right of way.
- No vehicles, no fixed sightings, no spectacle.
- Emphasis on:
- Natural history.
- Slow engagement.
- Low ecological footprint.
- Affordable access → not elitist eco-tourism.
Wider Environmental Context
- Himalayas:
- Road widening → frequent landslides.
- Tourism-led ecological stress.
- Aravallis:
- Legal definitions enabling mining and commercial use.
- Implication:
- Every intact natural habitat matters, even small private reserves.
Policy & Governance Insights
- Demonstrates potential of private conservation areas:
- Complementing state-run protected areas.
- Raises questions on:
- Regulation of “eco-tourism” labels.
- Incentivising genuine private reserves.
- Supports landscape-level conservation beyond notified parks.
Takeaway
- JNR shows that wildlife recovery is possible without fencing, spectacle, or mass tourism, if:
- Habitat integrity is prioritised.
- Human access is restrained, not eliminated.
- Local communities are stakeholders, not spectators.
Why Silver Prices Surged ~160% in 2025
Scale and Significance of the Surge
- Silver prices rose ~160% in 2025, outperforming gold.
- Prices crossed ₹2.4 lakh/kg by end-2025.
- Indicates a structural, not speculative-only, commodity rally.
Relevance
- GS-3 | Economy
- Commodity markets, inflation hedging, financialisation
- Gold–silver dynamics, impact of global monetary policy
Dual Nature of Silver: Investment + Industrial Metal
- Unlike gold (primarily a store of value), silver has:
- High industrial utility.
- Strong linkage with future technologies.
- Key demand sectors:
- Solar photovoltaics.
- Electric vehicles.
- Batteries and electronics.
- AI hardware and data centres.
Industrial Demand Boom
- Energy transition accelerated demand:
- Solar panels use silver paste.
- EVs require silver-intensive circuitry.
- AI-led digital expansion:
- Data centres, servers, chips increased silver consumption.
- Result:
- Silver demand grew faster than supply elasticity.
Supply-Side Constraints
- Silver production largely by-product mining (from zinc, copper).
- Constraints:
- Long gestation period for new mines.
- Environmental regulations.
- Declining ore grades.
- USGS additions to “critical minerals” list increased scrutiny but not short-term supply.
Global Supply Mismatches
- London silver shortage (Oct 2025):
- Physical availability tightened.
- Spot prices spiked sharply.
- Structural mismatch between:
- Physical silver demand.
- Paper silver instruments.
Financialisation & Investment Demand
- Rising gold prices spilled over into silver.
- Drivers:
- Inflation hedging.
- Currency depreciation fears.
- Safe-haven diversification.
- ETFs and mutual funds:
- Sharp inflows earlier in 2025.
- Some moderation later, but momentum sustained.
US–China & Geopolitical Factors
- Trade tensions disrupted metal supply chains.
- Tariffs and export controls:
- Raised costs.
- Encouraged stockpiling.
- Silver benefited as a strategic metal in clean-tech rivalry.
Comparison with Gold
- Gold:
- Safer, slower, policy-driven.
- Silver:
- More volatile.
- More sensitive to industrial cycles.
- Hence:
- Silver outperformed gold during tech- and energy-driven growth.
Turkman Gate
Why in News?
- Turkman Gate has re-entered public discourse due to:
- Renewed interest in Delhi’s Mughal-era urban heritage.
- Contemporary debates on historical memory of the Emergency (1975–77).
- Often cited as a symbolic site associated with Emergency-era excesses, especially in urban Delhi.
Relevance
- GS-1 | Modern Indian History
- Emergency (1975–77), urban history of Delhi
- GS-1 | Art & Culture
- Mughal-era urban architecture, heritage of Shahjahanabad
Historical Background
- Built in the 17th century during the reign of Shah Jahan.
- Part of the fortified city of Shahjahanabad.
- One of the historic gateways controlling entry into Old Delhi.
- Named after Shah Turkan, associated with local Sufi traditions.
- Cultural-religious significance:
- Site linked to the tomb of Shah Turkan.
- Popular belief associates the area with Razia Sultana (burial traditions).
Urban Context (Pre-Emergency)
- Area developed into:
- Dense residential settlement over centuries.
- Mixed-use neighbourhood with markets and small trades.
- Surroundings reflected organic urban growth, typical of medieval Indian cities.
Turkman Gate During the Emergency (1975–77)
- Emergency imposed under Indira Gandhi.
- Turkman Gate emerged as a major flashpoint in Delhi.
- Area targeted under:
- Slum clearance.
- Urban “beautification” and road-widening drives.
- Strong local resistance turned the site into:
- One of the most remembered urban episodes of the Emergency.
Symbolic Significance
- Represents:
- The intersection of heritage, population, and state power.
- How historic urban spaces became arenas for Emergency-era policies.
- Frequently referenced in:
- Academic works.
- Journalism.
- Oral histories of Delhi.
Contaminated Water Crisis in Indore & Bhopal
Why in News?
- At least 17 deaths in Indore linked to contaminated drinking water.
- Comptroller and Auditor General of India (CAG) audit highlights massive loss of treated water in Madhya Pradesh’s two largest cities.
- Madhya Pradesh High Court has:
- Declared access to clean drinking water a fundamental right.
- Sought a status report from the State government.
- Rising hospital admissions and public protests have intensified scrutiny.
Relevance
- GS-2 | Governance & Social Justice
- Right to clean drinking water (Article 21)
- Municipal governance, accountability, judicial intervention
- GS-3 | Infrastructure & Public Health
- Urban water management, non-revenue water, service delivery failures
Key Audit Findings (CAG)
Massive “Non-Revenue Water” Losses
- Indore:
- Water loss: 65–70% (2013–18).
- Bhopal:
- Water loss: 30–49%.
- Losses include:
- Physical losses: pipeline leaks, joint failures, reservoir overflows.
- Non-physical losses: theft, illegal connections, faulty meters, wastage.
Gap Between Water Drawn and Water Supplied
- Large discrepancy between:
- Raw water extracted.
- Water actually reaching households.
- CAG rejected municipal claims of lower losses as unsubstantiated.
Per Capita Water Supply Below Norms
- Bhopal:
- Claimed: 135 LPCD (litres per capita per day).
- CAG-estimated: 122 LPCD.
- Indore:
- Target: 150 LPCD.
- Claimed: 105 LPCD.
- Actual (CAG): 58 LPCD.
- Indicates chronic under-delivery despite high water abstraction.
Large Number of Unconnected Households
- As of 2018:
- Bhopal: ~1.43 lakh households without water connections.
- Indore: ~2.68 lakh households without water connections.
- Forces dependence on unsafe or informal water sources.
Public Health Dimension
- Contaminated water linked to:
- Kidney failure.
- Rising hospital admissions.
- Health crisis exposes:
- Direct linkage between infrastructure neglect and mortality.
Judicial Intervention
- Madhya Pradesh High Court observations:
- Clean drinking water = Article 21 (Right to Life).
- “No compromise” on water quality.
- Multiple PILs under hearing.
- Next hearing scheduled for 15 January 2026.
Governance & Policy Significance
- Highlights failures in:
- Urban local body capacity.
- Infrastructure maintenance.
- Public service delivery.
- Shows importance of:
- Audit institutions (CAG).
- Judicial oversight in basic services.
- Raises questions on:
- Sustainable urban water management.
- Accountability of municipal corporations.


