Content
- Biopharma SHAKTI & India’s Push into Biologics
- Education & Skilling Budget Push
- CCUS (Carbon Capture, Utilisation & Storage)
- High-Speed Rail Corridors
- Cheaper Cancer Drugs & Caregiver Training
- Waste-to-Energy (WtE)
- Livestock & Fisheries Push
- Rakhigarhi & Harappan Heritage
Biopharma SHAKTI & India’s Push into Biologics
Why in News ?
- Union Budget 2026–27 announced a ₹10,000 crore Biopharma SHAKTI programme to scale biologics and biosimilars, strengthen CDSCO regulation, and expand NIPER network, signalling strategic push toward biopharma self-reliance.
Relevance
GS-2 (Polity & Governance)
- Government policies & interventions in health sector
- Regulatory bodies (CDSCO) and reforms
- Public health & access to medicines
- Centre–State coordination in health governance
GS-3 (Economy, S&T, Internal Security)
- Biotechnology & pharma innovation
- Industrial policy (PLI, Make in India)
- R&D ecosystem and knowledge economy
- Biosecurity and dual-use technology risks
Biopharma – Basics
What is Biopharma
- Biopharmaceuticals are medicines derived from living organisms like cells or microbes, including vaccines, monoclonal antibodies, gene therapies, unlike small-molecule chemical drugs synthesized through conventional pharmaceutical chemistry.
Biologics vs Biosimilars
- Biologics are original complex biological medicines; biosimilars are highly similar follow-on versions with no clinically meaningful differences, offering cost-effective alternatives after reference product patent expiry.
Budget 2026–27 Biopharma SHAKTI – Key Features
Financial Allocation
- ₹10,000 crore outlay over multiple years targets R&D, manufacturing clusters, clinical ecosystems, regulatory strengthening, aiming to position India as a global biologics manufacturing hub.
Regulatory Strengthening
- Focus on upgrading Central Drugs Standard Control Organisation to global regulatory standards, enhancing scientific review capacity, predictable approvals, pharmacovigilance, and harmonisation with WHO/ICH norms.
Institutional Capacity
- Proposal to establish three new NIPERs and expand clinical trial infrastructure, creating skilled workforce pipelines for bioprocess engineering, regulatory science, translational research, and innovation-driven pharmaceutical growth.
Rationale Behind the Push
Health Transition
- Rising non-communicable diseases like cancer, diabetes, autoimmune disorders increase demand for advanced biologics, which offer targeted therapies and improved outcomes compared to conventional small-molecule drugs.
Economic Opportunity
- Global biologics market valued above US$400 billion and growing faster than traditional pharma; capturing biosimilar share can boost exports, high-value manufacturing, skilled employment, and technology upgrading.
Strategic Autonomy
- COVID-19 highlighted supply-chain vulnerabilities; domestic biologics capacity strengthens health security, vaccine sovereignty, critical drug resilience, aligning with Atmanirbhar Bharat and Make in India objectives.
Constitutional / Legal Dimension
- Aligns with Article 47 duty to improve public health, while regulatory strengthening under Drugs and Cosmetics Act, 1940 framework must ensure safety, efficacy, and ethical clinical practices.
Governance / Administrative Dimension
- Requires coordination between DBT, ICMR, CDSCO, state regulators, streamlined single-window approvals, and stronger bioethics oversight committees to maintain credibility in clinical research ecosystems.
Economic Dimension
- Biopharma shift supports move from volume-driven generics to value-driven innovation, enhancing gross value addition, export competitiveness, and integration into global pharmaceutical value chains.
Social / Ethical Dimension
- Biosimilars can reduce therapy costs by 20–40% globally, improving affordability; however, ethical concerns around clinical trials, informed consent, and data integrity require strict oversight.
Environmental / Tech / Security Dimension
- Biomanufacturing demands high bio-safety, waste management, cold-chain logistics, and digital bioprocess control systems; dual-use biotechnology risks necessitate strong biosecurity frameworks.
Data & Evidence
- India supplies ~20% of global generic medicines by volume but small biologics share; biologics contribute disproportionately to global pharma revenues, showing clear upgrading potential.
- India hosts 3,000+ pharma companies and 10,000+ manufacturing units, providing strong base for biologics scaling if supported by advanced biologics infrastructure and regulatory credibility.
Challenges / Gaps
- High capital intensity and long gestation periods deter private investment without risk-sharing or incentives, limiting domestic innovation beyond contract manufacturing and licensed biosimilar production.
- Regulatory unpredictability and limited reviewer capacity in biologics evaluation can delay approvals, affecting investor confidence and global acceptance of Indian biologics.
- Skilled workforce gaps in bioprocessing, regulatory science, and translational research constrain movement toward innovation-led biologics ecosystems.
- Fragmented industry–academia linkages reduce commercialization of research outputs, weakening innovation pipeline despite strong basic science institutions.
Way Forward
- Expand PLI-like incentives for biologics, encourage public–private partnerships, and create shared biomanufacturing facilities to reduce entry barriers for domestic firms.
- Strengthen regulatory science ecosystem through international collaborations, joint reviews, and continuous training to build globally trusted approval systems.
- Promote innovation clusters linking NIPERs, IITs, startups, and hospitals for translational research and faster lab-to-market pathways.
- Ensure ethical clinical trial frameworks, patient registries, and real-world evidence systems to build credibility and safety assurance.
Data & Facts
- India is the largest vaccine supplier globally, providing ~60% of global vaccine demand (UNICEF/WHO procurement).
- India accounts for ~20% of global generic drug exports by volume but <5% share in global biologics market, showing value-upgradation potential.
- Biologics constitute ~30–35% of global pharma market value but much smaller share in volume → high-value segment.
- USFDA-approved pharma plants: India has the highest number outside the USA (600+ facilities).
- R&D spending in Indian pharma ≈ 7–8% of revenue, lower than global innovators (15–20%), showing innovation gap.
- India’s bioeconomy crossed $80–90 billion and targets $300 billion by 2030 (DBT vision).
Education & Skilling Budget Push
Why in News ?
- Union Budget 2026–27 significantly raises education and skilling allocations to about ₹1.39 lakh crore (≈14.21% increase), alongside reforms linking education-to-employment pathways, signalling human-capital–led growth strategy.
Relevance
GS-2 – Polity & Governance / Social Justice (Education)
- Education policies & NEP 2020
- Article 21A, DPSPs
- Welfare state & human capital
- Social sector governance
GS-3 – Economy (Human Capital & Employment)
- Demographic dividend
- Skill mismatch & employability
- Labour productivity & growth
- Future of work & AI impact
Education & Skilling Push – Basics
Human Capital Logic
- Human capital theory (Schultz, Becker) views education and skills as productivity-enhancing investments, improving employability, incomes, innovation capacity, and long-term demographic dividend realization in a young country like India.
Education–Employment Link
- Persistent skill mismatch and graduate unemployability necessitate aligning curricula with industry demand, integrating vocational exposure, apprenticeships, and digital skills to convert schooling into productive workforce participation.
Budget 2026–27 – Key Announcements
Higher Allocation
- Education Ministry outlay ≈ ₹1.39 lakh crore, reflecting prioritisation of school education, higher education, and digital learning ecosystems, reversing pandemic-era learning losses and strengthening foundational literacy and numeracy.
Samagra Shiksha
- Samagra Shiksha allocation increased, supporting FLN under NIPUN Bharat, school infrastructure, teacher training, and inclusive education, aligning with NEP 2020’s holistic school framework.
Kendriya Vidyalaya Sangathan
- KVS funding rise (~₹600 crore increase) expands access to quality schooling for mobile populations, defence families, and aspirational districts, promoting equity and standardized public education quality.
Atal Tinkering Labs
- ATL allocation jumps from ~₹500 crore to ~₹2,700 crore, strengthening STEM, innovation culture, and early problem-solving exposure, nurturing future-ready skills and startup-oriented mindsets among students.
University Townships
- Proposal for five university townships integrates academia, research parks, and industry clusters, aiming to replicate global knowledge hubs and enhance research–industry linkages and local economic ecosystems.
Skill Development Push
- Skill Development Ministry outlay ≈ ₹8,885 crore supports PM Skill Development, apprenticeships, and industry-aligned training, targeting employability and formal workforce integration.
Education-to-Employment Panel
- Expert panel to design pathways from education to employment, focusing on curriculum redesign, internships, entrepreneurship support, and AI-era skills forecasting for dynamic labour markets.
Constitutional / Legal Dimension
- Advances Article 21A (Right to Education) and Directive Principles (Article 41, 45), reinforcing state duty toward education, skill-building, and opportunities for work under welfare-state constitutional vision.
Governance / Administrative Dimension
- Requires convergence among MoE, MSDE, state governments, NCERT, Sector Skill Councils, and robust outcome-based monitoring, avoiding duplication across centrally sponsored and state schemes.
Economic Dimension
- India’s median age ≈ 28 years offers demographic advantage; education–skilling investments raise labour productivity, female workforce participation, and formalisation, supporting sustained 8%+ growth aspirations.
Social / Ethical Dimension
- Improved public education spending reduces intergenerational inequality, supports social mobility, and addresses rural–urban, gender, and socio-economic disparities in access to quality learning and skills.
Tech / Future of Work Dimension
- AI and automation threaten routine jobs; policy emphasis on digital literacy, coding, AI, and design thinking prepares workforce for Industry 4.0 and gig economy realities.
Data & Evidence
- ASER reports show persistent learning gaps post-pandemic; only a fraction of youth receive formal vocational training compared to 50–60% in developed economies, justifying higher skilling investments.
- PLFS data repeatedly highlights educated-youth unemployment, indicating degree–job mismatch, reinforcing need for vocational integration and industry-linked curricula.
Challenges / Gaps
- Quality of spending remains concern; higher allocations may not translate into outcomes without teacher capacity, governance reforms, and accountability mechanisms.
- Fragmented skilling ecosystem and low industry participation limit placement outcomes, reducing credibility of short-term certification-based training programmes.
- Digital divide and unequal state capacities risk regional disparities in translating central allocations into actual learning and employment gains.
Way Forward
- Shift from input-based to outcome-based financing, linking funds with measurable learning and placement outcomes through transparent dashboards and third-party audits.
- Deepen apprenticeship reforms, incentivise MSMEs for trainee absorption, and embed vocational exposure within secondary education under NEP 2020.
- Build district-level skill mapping aligned with local economic clusters, ensuring context-specific training and reducing migration distress.
- Strengthen teacher training and EdTech integration, combining technology with pedagogy rather than substituting human instruction.
Data & Facts
- India has the world’s largest youth population (~65% below 35 years).
- Only ~5% of India’s workforce has formal vocational training, vs 50–60% in developed countries.
- ASER reports: basic reading and arithmetic levels still below pre-pandemic levels in many states.
- India spends ~4–4.5% of GDP on education, below NEP target of 6%.
- Female LFPR improving (~37%+) but still below global average, skilling critical for women’s employment.
- World Bank estimates one additional year of schooling raises earnings by ~8–10%.
CCUS (Carbon Capture, Utilisation & Storage)
Why in News ?
- Union Budget 2026–27 earmarks ₹20,000 crore for a national Carbon Capture, Utilisation and Storage (CCUS) scheme, signalling India’s intent to deploy deep-decarbonisation tools for hard-to-abate industrial sectors.
Relevance
GS-3 – Environment / Economy / Science & Tech
- Climate change mitigation
- Clean energy transition
- Environmental technologies
- Carbon markets & green economy
GS-2 – International Relations / Global Agreements
- Paris Agreement & CBDR
- Global climate governance
CCUS – Basics
What is CCUS ?
- CCUS involves capturing CO₂ at source, compressing and transporting it for utilisation in products or permanent geological storage, preventing atmospheric release from fossil-fuel-intensive industrial activities.
How it Works ?
- Process includes post-combustion or pre-combustion capture, pipeline or ship-based CO₂ transport, and injection into saline aquifers, depleted oil fields, or mineralisation systems for long-term containment.
Budget Scheme – Key Features
Financial Commitment
- ₹20,000 crore allocation provides catalytic funding for pilot projects, viability-gap support, and infrastructure creation, recognising CCUS as capital-intensive but essential for achieving net-zero by 2070 commitments.
Sectoral Focus
- Priority given to steel, cement, fertilisers, refineries, and thermal power, where process emissions are unavoidable and electrification alternatives remain technologically or economically constrained in the medium term.
Design Approach
- Emphasis on retrofit integration in existing facilities rather than greenfield-only plants, reducing transition costs, preserving assets, and enabling faster emissions reduction within India’s current industrial base.
Technology Development
- Scheme promotes indigenous R&D, demonstration plants, and shared transport-storage networks, aiming to build domestic technological capability and reduce long-term dependence on imported climate technologies.
Rationale Behind CCUS Push
Climate Commitments
- India’s Panchamrit targets include emissions-intensity reduction and net-zero by 2070; CCUS offers pathway for deep decarbonisation where renewables alone cannot fully eliminate industrial emissions.
Energy Transition Reality
- Coal still contributes major electricity share; CCUS enables cleaner fossil fuel use during transition, balancing developmental needs with climate responsibility under Common But Differentiated Responsibilities (CBDR) principle.
Global Policy Trends
- Countries like USA, UK, Norway incentivise CCUS through tax credits and carbon markets; India’s move aligns with emerging carbon border adjustment pressures and global green competitiveness norms.
Constitutional / Legal Dimension
- Supports Article 48A environmental protection duty and Article 21 right to life via pollution reduction, while future legal frameworks must regulate liability, monitoring, and long-term storage risks.
Governance / Administrative Dimension
- Requires coordination among MoEFCC, DST, Ministry of Power, and state pollution boards, plus robust MRV systems (Monitoring, Reporting, Verification) to ensure captured carbon is permanently contained.
Economic Dimension
- CCUS can protect energy-intensive export sectors from carbon tariffs, preserve jobs, and create new value chains in carbon-based products, enhanced oil recovery, and green construction materials.
Environmental Dimension
- Potential to reduce large-volume industrial emissions, yet lifecycle assessments must ensure net-negative outcomes, avoiding energy-intensive capture processes that indirectly increase fossil fuel consumption.
Technology / Security Dimension
- CO₂ pipelines and storage sites require leak-proof infrastructure, seismic assessments, and cybersecurity for digital monitoring systems, as accidental releases could undermine climate and safety objectives.
Data & Evidence
- IEA estimates global net-zero pathways require capturing 7–8 gigatonnes CO₂ annually by 2050, while current deployment remains below 10% of required scale, showing large expansion necessity.
- India’s steel and cement sectors together contribute significant industrial emissions share, making them prime candidates where CCUS yields high marginal abatement impact compared to incremental efficiency improvements.
Challenges / Gaps
- High capture costs (often US$40–100 per tonne globally) and uncertain carbon pricing reduce private-sector enthusiasm without predictable policy incentives or carbon-market integration.
- Long-term storage liability, leakage risks, and public acceptance concerns create regulatory and social hurdles, requiring transparent risk communication and strict environmental safeguards.
- CCUS may risk moral hazard by prolonging fossil-fuel dependence if not paired with renewable expansion and efficiency improvements.
Way Forward
- Develop carbon markets and pricing signals to make CCUS financially viable, integrating it with India’s emerging Carbon Credit Trading Scheme framework.
- Create CCUS clusters near industrial hubs and sedimentary basins, lowering transport costs and enabling shared infrastructure for multiple emitters.
- Encourage international technology partnerships and climate finance to de-risk early investments and accelerate learning curves.
- Ensure CCUS complements, not substitutes, renewable expansion and energy efficiency, maintaining balanced decarbonisation strategy.
Data & Facts
- CCUS currently captures ~45–50 million tonnes CO₂/year globally, while net-zero pathways need gigatonne-scale capture.
- IEA: CCUS required for ~15% of cumulative emissions reduction by 2070 globally.
- Steel and cement together contribute ~15–18% of global CO₂ emissions.
- Norway’s Longship project is a flagship national CCUS model.
- IPCC recognises CCUS as essential for hard-to-abate sectors.
- India is the 3rd largest CO₂ emitter, but per-capita emissions remain far below developed nations.
High-Speed Rail Corridors
Why in News ?
- Union Budget 2026–27 grants approval to seven high-speed rail corridors spanning about 4,000 km with planned ₹16 lakh crore outlay, aimed at accelerating regional connectivity and economic integration.
Relevance
GS-3 – Infrastructure / Economy
- Transport infrastructure
- Logistics efficiency
- Investment & growth multipliers
- Low-carbon mobility
High-Speed Rail – Basics
Concept
- High-Speed Rail (HSR) refers to passenger rail systems operating generally above 250 km/h on dedicated tracks, using advanced signalling, grade separation, and aerodynamic rolling stock for speed, safety, and reliability.
Global Context
- Countries like Japan, China, France demonstrate HSR’s role in reducing air-road congestion, cutting travel time, boosting regional economies, and enabling low-carbon mass mobility transitions.
Budget Announcement – Key Features
Identified Corridors
- Corridors include Mumbai–Pune, Pune–Hyderabad, Hyderabad–Bengaluru, Hyderabad–Chennai, Chennai–Bengaluru, Delhi–Varanasi, Varanasi–Siliguri, linking major economic, cultural, and demographic growth centres.
Financial Scale
- Estimated ₹16 lakh crore investment signals long-term infrastructure commitment, crowding-in private and multilateral finance, and positioning railways as backbone of India’s future transport and logistics architecture.
Travel Time Reduction
- Expected to reduce inter-city travel to 2–3 hours on many routes, with some segments targeting sub-one-hour connectivity, reshaping business travel, tourism flows, and labour mobility patterns.
Railway Capex Push
- Railways receive ₹2.78 lakh crore+ capital outlay, reflecting prioritisation of network modernisation, safety, capacity augmentation, and technological upgrading alongside dedicated freight and passenger corridors.
Rationale Behind HSR Push
Economic Multiplier
- Large rail projects generate high forward–backward linkages in steel, cement, electronics, construction, and services, supporting job creation and regional industrial ecosystems during construction and operation phases.
Urbanisation & Mobility
- Rapid urbanisation requires efficient inter-city mobility; HSR enables polycentric urban growth, reducing megacity pressure and promoting satellite-city development along transport corridors.
Energy & Climate Logic
- Electrified HSR has lower per-capita emissions than aviation and highways, supporting India’s climate goals and reducing fossil-fuel import dependence in the transport sector.
Constitutional / Legal Dimension
- Advances cooperative federalism under Union–State infrastructure coordination, while land acquisition must respect RFCTLARR Act 2013, ensuring fair compensation, consent, and rehabilitation safeguards.
Governance / Administrative Dimension
- Requires strong project management, inter-ministerial coordination, and institutional capacity in Indian Railways, NHSRCL, state agencies, with transparent procurement and time-bound execution to avoid cost overruns.
Economic Dimension
- Improved connectivity can raise regional productivity, tourism revenues, real estate development, and supply-chain efficiency, contributing to sustained high-growth trajectory and logistics cost reduction.
Social / Ethical Dimension
- Better connectivity improves access to opportunities, education, healthcare, yet displacement, land conflicts, and fare affordability concerns require inclusive planning and stakeholder consultations.
Technology / Security Dimension
- HSR depends on advanced signalling, Kavach-based safety systems, automatic train control, and cyber-secure digital networks, making technological reliability and data security critical national priorities.
Environmental Dimension
- While rail is greener than road or air, construction impacts on forests, wildlife corridors, and land use necessitate rigorous EIAs, mitigation plans, and compensatory afforestation.
Data & Evidence
- Rail is among the most energy-efficient transport modes; globally, HSR corridors often shift significant passenger share from aviation on 300–800 km routes, reducing congestion and emissions.
- India’s logistics costs remain around 13–14% of GDP; faster, efficient rail networks can structurally reduce these costs, enhancing export competitiveness.
Challenges / Gaps
- High capital intensity and long gestation risk fiscal stress and delays, especially with complex land acquisition and multi-state coordination requirements.
- Ensuring commercial viability and adequate ridership is critical; poorly estimated demand could burden public finances and reduce cost-effectiveness.
- Technology dependence on foreign partners may limit domestic value addition without strong localisation and technology-transfer frameworks.
Way Forward
- Adopt phased implementation prioritising high-demand corridors, ensuring financial sustainability and early success demonstration.
- Promote Make in India for rolling stock and signalling, enhancing domestic manufacturing and technology absorption.
- Integrate HSR with multimodal transport planning, including metro, bus, and airports for seamless last-mile connectivity.
- Ensure transparent cost–benefit analysis and public communication to build trust and social acceptance.
Data & Facts
- Japan’s Shinkansen has operated since 1964 with near-zero fatal accidents → global safety benchmark.
- Rail emits up to 70–80% less CO₂ per passenger-km than aviation (IEA estimates).
- Infrastructure multiplier: ₹1 spent can generate ₹2–2.5 economic output (various infrastructure studies).
- China built 40,000+ km HSR network, linking regional growth clusters.
- India’s logistics cost 13–14% of GDP vs 8–9% in developed countries.
Cheaper Cancer Drugs & Caregiver Training
Why in News ?
- Union Budget 2026–27 announces customs duty exemption on 17 cancer-related drugs, addition of 7 rare diseases to concessional import list, and training of 1.5 lakh caregivers, signalling targeted health-sector relief.
Relevance
GS-2 – Social Justice / Health
- Public health policy
- Access to medicines
- Welfare schemes
- Right to health dimension
GS-3 – Economy (Health Sector)
- Pharma industry
- Health workforce economics
- Social sector expenditure
Context & Basics
Cancer & Rare Diseases in India
- India witnesses rising cancer burden and significant rare disease treatment gaps, driven by high drug costs, import dependence, limited domestic R&D, and shortage of trained caregiving and allied health workforce.
Caregiver Role
- Caregivers provide long-term physical, emotional, and rehabilitative support, especially critical for oncology, geriatrics, and chronic diseases, reducing hospital load and improving treatment adherence and outcomes.
Budget Announcements – Key Features
Cheaper Cancer Drugs
- Full customs duty exemption on 17 cancer-related drugs and medicines lowers import costs, improving affordability for patients undergoing long-term, high-cost oncology treatment.
Rare Diseases Support
- Seven additional rare diseases included in duty-free import list for drugs, medicines, and special foods for personal use, expanding coverage under India’s evolving rare disease policy ecosystem.
Caregiver Training
- 1.5 lakh caregivers to be trained under National Skills Qualifications Framework (NSQF), integrating skills like wellness, yoga, basic medical operations, assistive devices, strengthening community-level healthcare support.
Health Expenditure Snapshot
- Health Ministry allocation ≈ ₹1.05 lakh crore for FY 2026–27, reflecting modest growth (~6–9%), with prioritisation of targeted relief over large headline expansion.
Rationale Behind the Measures
Affordability & Access
- High out-of-pocket expenditure (OOPE) in cancer care pushes families into poverty; tax exemptions directly reduce treatment costs where domestic alternatives are unavailable.
Demographic & Epidemiological Transition
- Ageing population and rising NCD prevalence increase demand for long-term care and palliative services, necessitating trained caregiver workforce beyond doctors and nurses.
Health System Efficiency
- Trained caregivers enable task shifting, reduce doctor overload, shorten hospital stays, and strengthen continuum of care from hospitals to homes.
Constitutional / Legal Dimension
- Advances Article 21 (Right to Life) through improved access to essential medicines and care, and aligns with Article 47 directing the State to improve public health and nutrition.
Governance / Administrative Dimension
- Requires coordination among MoHFW, MSDE, Customs authorities, state health departments, and standardised certification under NSQF to ensure quality, safety, and portability of caregiver skills.
Economic Dimension
- Reduced drug costs ease catastrophic health expenditure, while caregiver skilling creates health-sector employment, especially for women, supporting inclusive growth and service-sector expansion.
Social / Ethical Dimension
- Improves equity in access to life-saving drugs for cancer and rare diseases; ethical imperative to support vulnerable patients with limited treatment alternatives.
- Formal recognition of caregivers enhances dignity of care work, often undervalued and informal.
Health System / Technology Dimension
- Complements expansion of clinical trial sites, drug regulatory strengthening, and allied health professional scaling, moving toward team-based, technology-supported care models.
Data & Evidence
- Cancer treatment can cost several lakhs per year, with medicines forming a major share of OOPE; duty exemptions can meaningfully reduce end prices for imported therapies.
- India faces a shortage of allied health professionals relative to demand, particularly in geriatrics, oncology support, and home-based care.
Challenges / Gaps
- Modest overall health budget growth limits systemic expansion of public healthcare infrastructure.
- Duty exemptions help only imported drugs; absence of domestic manufacturing keeps long-term costs vulnerable to exchange-rate and supply shocks.
- Caregiver training must ensure quality control, supervision, and ethical standards to avoid unsafe task shifting.
Way Forward
- Incentivise domestic production of oncology and rare-disease drugs through R&D grants, PLI-like schemes, and faster regulatory approvals.
- Integrate trained caregivers into Ayushman Bharat–PMJAY, geriatric care, and palliative care programmes for institutional linkage and demand certainty.
- Expand public oncology infrastructure and early screening to complement drug affordability measures.
- Establish clear legal scope of practice for caregivers, ensuring patient safety and professional accountability.
Data & Facts
- Cancer cases in India projected to cross 1.5 million annually (ICMR estimates).
- OOPE still forms ~48–50% of total health expenditure in India, among highest globally.
- Rare diseases affect ~70–90 million Indians (estimated).
- India has doctor–population ratio ~1:1500 (below WHO ideal 1:1000) → need allied workforce.
- Palliative care access remains limited; only ~1–2% of those in need receive it.
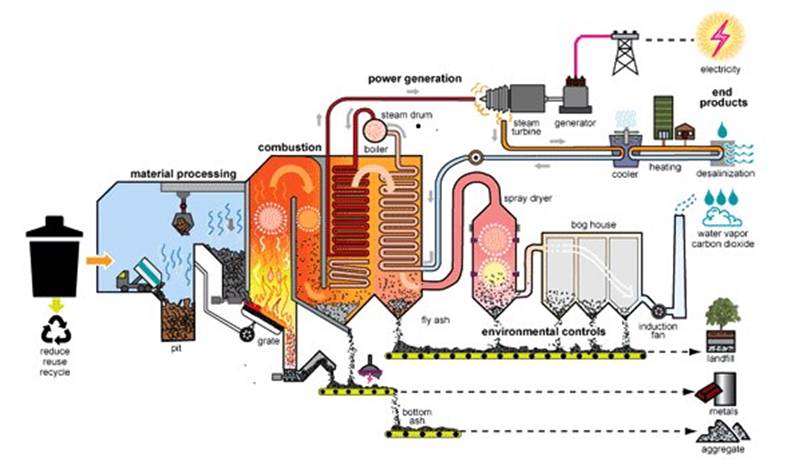
Waste-to-Energy (WtE)
Why in News ?
- Urban India’s rising solid waste burden, landfill crises, and policy push under Solid Waste Management Rules 2016 (amended) have renewed focus on Waste-to-Energy (WtE) as a waste-processing and energy-recovery solution.
Relevance
GS-3 – Environment / Ecology
- Solid waste management
- Pollution control
- Circular economy
- Renewable energy debates
GS-2 – Governance (Local Bodies)
- Urban Local Bodies’ role
- Environmental regulation
Waste-to-Energy – Basics
Definition
- Waste-to-Energy (WtE) converts non-recyclable solid waste into usable energy—electricity, heat, or fuel through thermal, chemical, or biological processes, reducing landfill volumes while recovering embedded energy from waste streams.
Major Technologies
- Incineration burns waste at high temperatures for steam-electricity generation; gasification/pyrolysis convert waste into syngas with limited oxygen; anaerobic digestion uses microbes to produce biogas from organic waste.
Policy & Regulatory Framework
Solid Waste Management Rules
- SWM Rules 2016 mandate source segregation, scientific processing, and RDF promotion, positioning WtE as a residual-waste treatment option after recycling and composting to reduce landfill dependency.
Institutional Ecosystem
- MoHUA, CPCB, State Pollution Control Boards, ULBs regulate and monitor WtE plants, setting emission norms, environmental clearances, and compliance standards for air pollutants and ash disposal.
Rationale for WtE Push
Urbanisation & Waste Surge
- India generates ~1.5–1.7 lakh tonnes of MSW daily, projected to rise with urbanisation and consumption; WtE offers volume reduction and partial energy recovery from otherwise landfilled waste.
Land Scarcity
- Megacities face landfill saturation and land constraints; WtE can reduce waste volume up to ~80–90%, extending landfill life and easing urban land-use pressures.
Climate Link
- Diverting waste from dumpsites reduces methane emissions, a potent greenhouse gas; controlled combustion with safeguards can be climatically preferable to open dumping and burning.
Constitutional / Legal Dimension
- Supports Article 48A environmental protection and Article 21 right to clean environment, while invoking polluter pays and precautionary principles recognised in Indian environmental jurisprudence.
Governance / Administrative Dimension
- Effective WtE requires strict segregation at source, reliable feedstock quality, long-term municipal contracts, and credible monitoring capacity, often weak across Urban Local Bodies with fiscal and technical constraints.
Economic Dimension
- WtE plants are capital-intensive with high operating costs; financial viability depends on tipping fees, power tariffs, and assured waste supply agreements, raising concerns over long-term fiscal sustainability.
Environmental Dimension
- Poorly managed WtE emits dioxins, furans, particulate matter, heavy metals; safe operation demands advanced flue-gas treatment, continuous emission monitoring, and scientific ash disposal.
Social / Ethical Dimension
- Informal waste pickers risk livelihood loss if recyclable streams divert to incineration; inclusive policy must integrate them into segregation, recycling value chains, and formal waste management systems.
Technology Dimension
- Indian waste has high moisture and low calorific value due to organic content, reducing incineration efficiency; technological adaptation and better segregation are critical for optimal plant performance.
Data & Evidence
- India has 20+ WtE plants and over 100 biogas facilities operational; several plants historically faced shutdowns due to poor segregation, community opposition, and emission concerns.
- Studies show recycling often saves more energy and emissions than incineration, supporting the waste hierarchy prioritising reduce–reuse–recycle before recovery.
Challenges / Gaps
- Mixed waste collection undermines calorific value and raises pollution risks, making many WtE projects technologically and environmentally suboptimal.
- Community resistance arises from health concerns, siting issues, and trust deficits regarding emission compliance and monitoring transparency.
- Overemphasis on WtE may create perverse incentives to burn recyclables, discouraging circular-economy practices like composting and material recovery.
Way Forward
- Enforce strict source segregation and decentralised composting for wet waste, reserving WtE only for non-recyclable, high-calorific residual fractions consistent with waste-hierarchy principles.
- Strengthen real-time emission monitoring, public disclosure, and third-party audits to build trust and ensure environmental compliance.
- Integrate informal workers into formal systems through MRFs, cooperatives, and social security, ensuring just transition.
- Promote circular economy policies, EPR, and waste reduction to address root causes rather than relying solely on end-of-pipe solutions.
Data & Facts
- India generates ~55–60 million tonnes MSW annually, projected to double by 2030.
- ~70–75% waste remains unsegregated in many cities.
- Methane from landfills has 28x higher warming potential than CO₂ (IPCC).
- EU waste hierarchy prioritises: Reduce → Reuse → Recycle → Recover → Dispose.
- Sweden imports waste for energy due to advanced segregation and WtE systems.
Livestock & Fisheries Push
Why in News ?
- Union Budget 2026–27 announces higher allocations and new schemes for livestock and fisheries, focusing on value-chain development, entrepreneurship, and rural employment, signalling diversification of farm incomes beyond crop agriculture.
Relevance
GS-3 – Agriculture / Economy
- Allied agriculture sectors
- Blue economy
- Food processing & exports
- Rural income diversification
GS-2 – Governance / Welfare
- Farmer welfare policies
- Institutional credit systems
Sector Basics
Livestock Sector
- Livestock includes dairy, poultry, sheep-goat, and allied activities, contributing significantly to agricultural GVA, nutrition security, and supplementary farmer incomes, especially for smallholders and landless households.
Fisheries Sector
- Fisheries span marine, inland, and aquaculture systems, supporting coastal and inland livelihoods, exports, and protein supply, with India among the top global fish producers.
Budget Announcements – Key Features
Fisheries Push
- Enhanced outlay for Fisheries Ministry (~₹2,761.8 crore), supporting one of the world’s largest inland reservoir networks (~31.5 lakh hectares), targeting value addition, infrastructure, and export competitiveness.
Value-Chain Development
- Focus on cold chains, processing, storage, and market linkages, aiming to reduce post-harvest losses and increase farmer realisation across fisheries and animal husbandry value chains.
Entrepreneurship & Start-ups
- Promotion of start-ups, women-led groups, and FPOs in fisheries and livestock, integrating them into formal value chains and improving access to credit, technology, and markets.
Animal Husbandry Allocation
- Animal Husbandry Ministry allocation (~₹6,153.46 crore), reflecting ~21% increase, directed toward breed improvement, veterinary services, and disease prevention initiatives.
Credit-Linked Support
- Push for entrepreneurship via credit-linked subsidy schemes, encouraging private investment in dairy units, hatcheries, feed mills, and processing enterprises.
Rationale Behind the Push
Income Diversification
- Non-crop sectors stabilise farm incomes against monsoon and price volatility, supporting the policy goal of doubling farmers’ income through diversification.
Nutrition Security
- Livestock and fish provide high-quality protein and micronutrients, addressing malnutrition and dietary diversity concerns highlighted in nutrition surveys.
Export Potential
- Marine products are major agri-exports; value addition and quality compliance can boost foreign exchange earnings and global competitiveness.
Constitutional / Legal Dimension
- Aligns with Article 48 directive to improve animal husbandry on scientific lines and Article 47 on nutrition and public health.
Governance / Administrative Dimension
- Implementation requires coordination among DAHD, Department of Fisheries, state veterinary services, MPEDA, NABARD, and robust disease surveillance and extension systems.
Economic Dimension
- Livestock contributes around 30%+ of agricultural GVA in recent years; strengthening these sectors enhances rural employment, MSME growth, and value-added exports.
Social / Ethical Dimension
- Livestock and fisheries support women’s economic participation and livelihoods of marginal communities; ethical issues include animal welfare and sustainable fishing practices.
Environmental Dimension
- Overfishing, habitat degradation, and livestock methane emissions pose sustainability concerns; policies must integrate sustainable aquaculture, breed management, and climate-smart practices.
Technology Dimension
- Adoption of genetic improvement, vaccines, IoT-based monitoring, and modern feed practices can raise productivity and reduce disease and mortality risks.
Data & Evidence
- India ranks among the largest milk and fish producers globally; fisheries exports have crossed billions of dollars annually, reflecting strong global demand.
- Post-harvest losses in fisheries and perishables remain high without cold-chain infrastructure, justifying logistics investments.
Challenges / Gaps
- Disease outbreaks (e.g., in poultry or cattle) can cause large income shocks; veterinary infrastructure and surveillance remain uneven across states.
- Fragmented supply chains and limited processing capacity reduce farmer share in consumer prices.
- Environmental stress and climate variability threaten fish stocks and fodder availability.
Way Forward
- Strengthen cold-chain and processing infrastructure through PPP models and viability-gap funding.
- Expand animal health coverage, vaccination drives, and digital livestock registries for traceability and disease control.
- Promote sustainable fisheries management—regulated catch, aquaculture standards, and habitat conservation.
- Integrate farmers into FPOs and cooperatives to improve bargaining power and market access.
Data & Facts
- Livestock contributes ~30%+ to agricultural GVA, higher than crops in some years.
- India is largest milk producer globally.
- Fisheries sector grows at ~8–10% annually, among fastest in agriculture.
- Marine exports cross $7–8 billion annually.
- Protein deficiency remains concern; per capita protein intake below global norms.
- FAO: aquaculture is the fastest-growing food production sector globally.
Rakhigarhi & Harappan Heritage
Why in News ?
- Union Budget 2026–27 proposes developing Rakhigarhi, a major Harappan civilisation site in Haryana, as a cultural-tourism hub, but local concerns over slow progress and land issues triggered public dissatisfaction.
Relevance
GS-1 – History & Culture
- Indus Valley civilisation
- Archaeology & heritage
- Art & culture
GS-2 – Governance / Culture
- Heritage conservation policy
- Role of ASI & legislation
Rakhigarhi – Basics
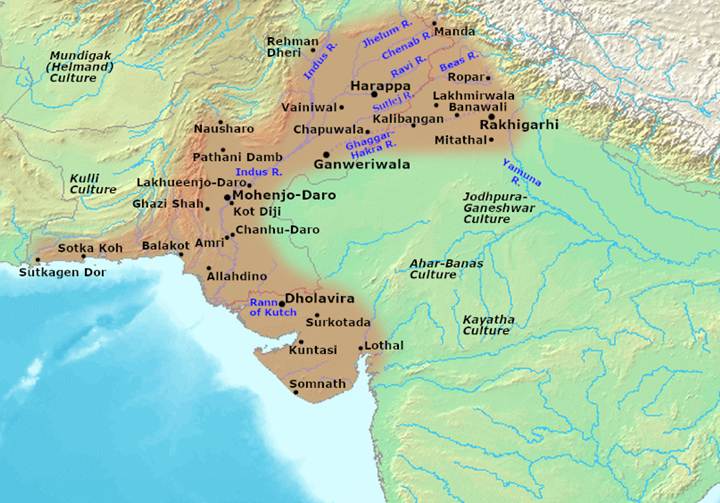
Location & Identity
- Rakhigarhi, located in Hisar district, Haryana, is among the largest Harappan (Indus Valley) sites in the means subcontinent, often compared with Mohenjo-daro and Harappa in scale and complexity.
Chronology
- Site dates roughly to 2600–1900 BCE (Mature Harappan phase), with evidence of earlier and later cultural layers, helping reconstruct the evolution and decline of the Indus Valley Civilisation.
Archaeological Significance
- Excavations revealed planned streets, drainage systems, craft production areas, burials, and artefacts, indicating advanced urban planning, trade networks, and social organisation typical of Harappan culture.
Key Budget & Policy Announcement
Heritage Development Push
- Government proposes integrated site development, museum creation, and tourism infrastructure to convert Rakhigarhi into a global heritage destination, linking conservation with local economic opportunities.
Part of Wider Revamp
- Rakhigarhi included in plan to revamp multiple archaeological sites, reflecting policy shift toward heritage-led development and cultural tourism as soft-power and local-growth instruments.
Historical & Cultural Importance
Civilisational Value
- Rakhigarhi strengthens understanding that Harappan civilisation extended deep into present-day India, countering earlier Pakistan-centric geographic perception and enriching India’s civilisational narrative.
Knowledge Contributions
- Findings on diet, burial practices, pottery, metallurgy, and settlement patterns provide insights into Harappan lifestyle, trade, and social differentiation, valuable for archaeology and ancient history studies.
Constitutional / Legal Dimension
- Conservation aligns with Article 49 obligating State to protect monuments of national importance and with Ancient Monuments and Archaeological Sites and Remains Act, 1958 governing protected heritage sites.
Governance / Administrative Dimension
- Development requires coordination among ASI, State Government, Tourism Ministry, and local administration, balancing heritage protection, land acquisition, rehabilitation, and community participation.
Economic Dimension
- Heritage tourism can generate local employment, MSME growth, hospitality demand, and rural infrastructure, turning archaeological assets into sustainable economic multipliers for surrounding communities.
Social / Ethical Dimension
- Local resistance arises when communities perceive displacement risks, inadequate compensation, or exclusion from benefits, highlighting need for participatory and inclusive heritage-development models.
Cultural Diplomacy / Soft Power
- Showcasing Harappan heritage strengthens India’s civilisational diplomacy, global academic collaborations, and cultural branding, similar to how Egypt leverages ancient heritage for soft power.
Data & Evidence
- Rakhigarhi spreads across multiple mounds over large area, making it one of the most extensive Harappan sites; DNA and material studies from the site informed debates on Harappan origins.
Challenges / Gaps
- Slow excavation pace, funding constraints, and conservation delays reduce research potential and public trust in development promises.
- Encroachments and agricultural activity risk site degradation, threatening stratigraphic integrity and long-term archaeological value.
- Over-commercialisation may compromise authenticity and scientific conservation if tourism priorities overshadow archaeological protocols.
Way Forward
- Adopt community-based heritage management, ensuring locals gain from tourism via jobs, homestays, and services, building local stewardship for conservation.
- Increase archaeological funding, scientific excavation, and digital documentation using GIS, 3D mapping, and residue analysis for global-standard research.
- Develop site museums and interpretation centres for public education, linking Rakhigarhi with broader Harappan heritage circuits.
Data & Facts
- Rakhigarhi spans ~350 hectares+, making it among the largest Harappan sites.
- Indus Valley Civilisation covered ~1.3 million sq km, larger than Egypt & Mesopotamia combined.
- Harappans used standardised bricks (1:2:4 ratio) → advanced civil engineering.
- No monumental temples/palaces found → suggests relatively egalitarian urban planning.
- DNA studies show complex indigenous population history without simplistic invasion narratives.


