Content
- Industrial growth jumps to four-month high of 3.5%
- Lost villages and other costs of coalfields
- Should States be compensated for revenue loss from GST reforms?
- Which sectors are worst hit by tariffs?
- School enrolment in 3-11 age group down by 25 lakh: UDISE+
- Centering elderly women: caring for the quiet majority
Industrial growth jumps to four-month high of 3.5%
Understanding the Index of Industrial Production (IIP)
- Definition: IIP measures the volume of production of different industry groups (manufacturing, mining, electricity).
- Base year: 2011–12.
- Weightage:
- Manufacturing: ~77%
- Mining: ~14%
- Electricity: ~8%
- Importance:
- Monthly indicator of industrial health.
- Proxy for economic activity and GDP (particularly industry sector).
- Guides policy interventions in demand, supply, and infrastructure.
Relevance : GS 3(Indian Economy)
Key Data: July 2025
- Overall industrial growth:
- 3.5% (July 2025) – four-month high.
- Lower than 5% (July 2024) → deceleration YoY.
- Sectoral performance:
- Manufacturing: +5.4% (six-month high), up from 4.7% in July 2024.
- Electricity: +0.6% (weak growth vs double-digit levels last year).
- Mining: -7.2% (fourth straight month of contraction).
- Use-based classification:
- Capital goods: +5% → investment revival.
- Consumer durables: +7.7% (seven-month high).
- Consumer non-durables: +0.5% (eight-month high, but very low absolute growth).
- Basic metals, fabricated metals, electrical machinery: strong double-digit growth.
- Non-metallic minerals: +9.5% → infra and construction push.
Why Growth Picked Up in July 2025
- Manufacturing rebound:
- Recovery after two months of contraction.
- Driven by investment demand (metals, machinery).
- Consumer durables revival shows festive/pre-festive demand pickup.
- Electricity slowdown:
- Monsoon impact → lower power demand from irrigation.
- High base effect (double-digit growth in 2024).
- Mining contraction:
- Seasonal monsoon disruption in coal, iron ore, limestone.
- Subdued global commodity demand, especially in China.
- Regulatory and environmental bottlenecks.
- Consumer goods mixed trend:
- Durables (+7.7%) → white goods, electronics, appliances supported by urban demand and credit growth.
- Non-durables (+0.5%) → rural demand still sluggish due to erratic monsoon, food inflation pressures.
Structural Takeaways
- Investment revival signals: Capital goods + basic/intermediate goods expansion → infra + capex cycle strengthening.
- Rural–urban divergence: Strong urban discretionary demand, weak rural essentials.
- Policy sensitivity: RBI likely to watch rural weakness + commodity volatility for growth–inflation trade-off.
- Mining as a drag: Persistent contraction risks supply-side constraints for core industries (steel, cement, power).
- Base effect reality: Lower growth vs July 2024 highlights statistical distortion – economy grew on a high base last year.
Implications
- For GDP growth (Q2 FY26):
- Industrial sector contribution may be moderate due to mining weakness + slower electricity.
- Manufacturing strength prevents sharp slowdown.
- For government policy:
- Need for rural demand stimulus (via MSP, rural jobs, credit).
- Mining reforms (ease clearances, monsoon-resilient infra).
- Support electricity diversification (RE integration, industrial demand).
- For markets & industry:
- Metals, machinery, and consumer durables show strong prospects.
- FMCG (non-durables) growth remains tepid, rural stress may weigh on stock performance.
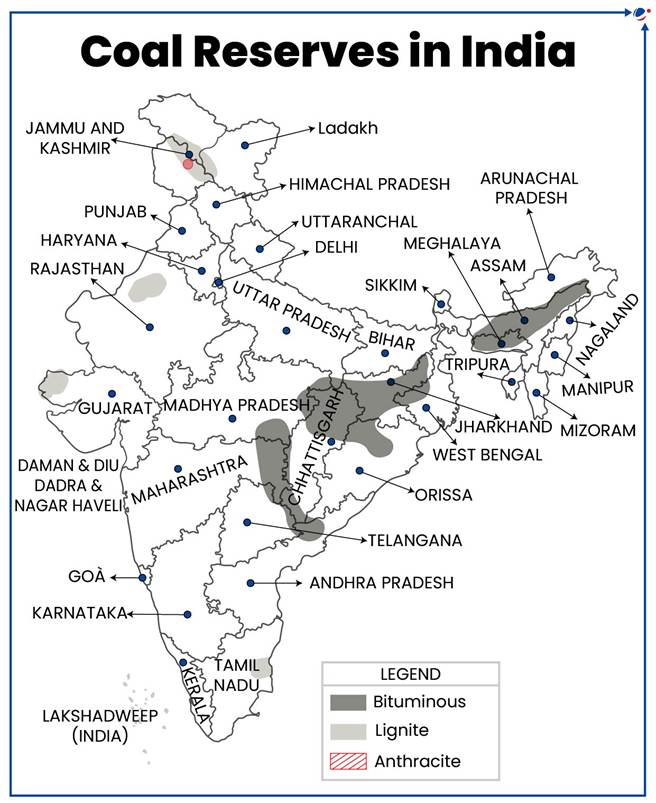
Lost villages and other costs of coalfields
Coal Mining and Displacement in India
- Coal in India:
- India has 389.42 billion tonnes of estimated reserves (2024).
- Odisha is the largest coal reserve holder: 99.2 billion tonnes (25.5% of India).
- Coal still supplies ~45.65% of India’s electricity capacity (June 2025).
- Talcher Coalfields (Angul, Odisha):
- Largest in India.
- Angul spans 6.3 lakh hectares, with 32% cultivable land, 43% forests, and 12.26% coal-bearing areas.
- 66 coal blocks identified; 12 operational, 2 about to start.
- If all blocks become active → 348 villages to be displaced.
- Displacement in Odisha:
- 5,923 families displaced in past 5 years (2019–24), mainly from Angul.
- Angul accounts for 48% of Odisha’s coal production (269.71 MT in 2024).
Relevance : GS 3(Environment and Ecology)
Human Cost of Displacement
- Loss of community & cultural identity:
- Example: Antaryami Pradhan had to travel 10 km for his brother’s cremation as new village denied him land.
- Villagers scattered → weakened social cohesion.
- Disruption of livelihoods:
- Farmers, cattle rearers, milkmen lose land & traditional professions.
- Rehabilitation colonies often lack open space for farming.
- Psychological & social alienation:
- New villagers don’t accept displaced families socially.
- Migrants often feel like outsiders even in new houses.
- Gendered impacts:
- Pregnant/lactating women lose access to health workers and schemes post-relocation.
- Women bear additional burden of household and social adjustment.
Compensation & Rehabilitation Issues
- Compensation discrepancies:
- Example:
- SCCL (Telangana) offers ₹70 lakh/acre.
- Gopiballavpur villagers offered only ₹11 lakh/acre.
- Within Angul, land valuation varies drastically between adjacent villages (e.g., ₹35 lakh vs ₹17 lakh per acre).
- Example:
- R&R (Rehabilitation & Resettlement) packages:
- Options include:
- ₹35 lakh (cash in lieu of employment + self-relocation).
- ₹31 lakh + land at R&R colony.
- Issues:
- R&R colonies often delayed or on disputed land (e.g., forest land challenged at NGT).
- Many forced to rent or return to old villages.
- Options include:
- Failure in implementation:
- Law requires resettlement colonies before displacement → often violated.
- Welfare schemes (health, nutrition, education) do not transfer automatically post-relocation.
Larger Structural Concerns
- Fragmented governance:
- No centralised displacement database in Angul.
- Land acquisition handled piecemeal → policies differ across projects.
- Legal & policy shifts:
- 2014: SC cancelled 204 coal block allocations (including 8 in Angul).
- 2015: Coal Mines (Special Provisions) Act allowed auctions.
- 2020: Commercial coal mining introduced → private & foreign players entered.
- Outcome → increased pace of land acquisition & displacement.
- Energy paradox:
- India pushes renewables but still heavily dependent on coal.
- Angul remains at the epicenter of India’s coal–development trade-off.
Socio-Economic & Environmental Impact
- Economic paradox:
- Some families receive life-changing sums but cannot buy equivalent land in towns.
- Compensation often erodes quickly without sustainable livelihood alternatives.
- Environmental stress:
- Villages, forests, agricultural lands consumed by expanding open-cast mines.
- Ecological degradation (loss of forest cover, dust pollution, groundwater depletion).
- Education disruption:
- Schools demolished → children’s education interrupted.
- Families caught in limbo delay investments in education due to uncertain future.
- Rural–urban shift stress:
- Villagers struggle to adapt to urban costs & lifestyles.
- Loss of access to affordable vegetables, community services, and collective rural economy.
Implications
- For displaced communities:
- Identity erosion, livelihood collapse, weak social absorption → long-term vulnerability.
- Inter-generational impact as children lose educational continuity and cultural roots.
- For governance & policy:
- Need for uniform, transparent, and inflation-adjusted compensation.
- Collective relocation models (keeping villages intact) rather than atomised dispersal.
- Transfer of welfare entitlements (PDS, Anganwadi, health services) to new sites.
- Centralised displacement tracking & accountability mechanism.
- For India’s energy policy:
- Rising dependence on Odisha coalfields → concentrated risk.
- Balancing energy security vs social justice vs environmental sustainability will be a defining challenge.
- Transition to renewables must consider a “just transition” framework for coal-dependent regions.
Should States be compensated for revenue loss from GST reforms?
Basics of GST
- GST launched: July 1, 2017, as a destination-based, indirect tax subsuming central (excise, service tax, CST) and state taxes (VAT, entry tax, octroi).
- Current structure: Multiple slabs (0%, 5%, 12%, 18%, 28%) + special rates (gold, precious stones) + cess (luxury/sin goods).
- Revenue sharing: GST collected is split between Centre and States (CGST + SGST; IGST for inter-state).
- Compensation principle (2017–2022): Centre guaranteed States 14% annual revenue growth, bridging losses via Compensation Cess on luxury/sin goods (cars, tobacco, aerated drinks).
Relevance : GS 3(Economy – Taxation)
Proposed Reform
- Move from 4–5 slab system → 2-tier (5% & 18%), with essentials exempt or 0% rated.
- Higher tax (40%) to continue on luxury/sin goods.
- Target average GST rate: reduce from ~11.5% (current) to ~10%.
- Objective:
- Simplification → compliance ease.
- Lower rates → boost consumption, formalisation, investment.
- At par with developed economies (average GST/VAT 10–12%).
Likely Revenue Impact
- Short-term dip inevitable:
- Estimated ₹60,000–1,00,000 crore/year loss (~0.2–0.3% of GDP).
- FY2025–26: ~₹45,000 crore hit (partial year implementation).
- Medium/long term gains:
- Wider tax base: More consumption under formal economy.
- Leakage reduction: Simplified slabs reduce classification disputes.
- Demand boost: Lower rates on consumer durables/essentials → higher sales volume → more GST.
- Luxury/sin cess: Higher rates (40%) to partly offset revenue fall.
Impact on States
- Unequal effect across States:
- Manufacturing/urban States (Maharashtra, Karnataka, Tamil Nadu): Larger revenue hit as bulk of GST collections come from industrial goods and services.
- Agrarian/consumption-heavy States (Bihar, UP, NE States): Smaller impact since their GST base is narrower and skewed towards essentials (already exempt/low slab).
- Past experience: July 2018 GST cuts → Maharashtra/Karnataka collections dipped 3–4%, but NE states unaffected.
- Revenue distribution remains unequal: Richer States lose more; poorer States less affected.
Compensation Question
- Legal status: 5-year compensation period (2017–2022) ended; technically Centre has no liability now.
- Arguments against further compensation:
- Perpetual transfers unsustainable.
- States should expand their tax base, plug leakages, attract investment.
- Alternative: allocate funds for infrastructure or contingency, not continuous GST gap-filling.
- Arguments for compensation:
- Asymmetry in GST revenue distribution → small states structurally disadvantaged.
- Global precedent: Countries like Australia/Canada initially provided both GST-linked compensation + consolidated fund support.
- Equity demands special packages for less industrialised states.
- Possible middle ground:
- Create Contingency/Equalisation Fund from part of GST or Consolidated Fund of India.
- Use mechanism like Kerala Flood Cess for State-specific needs.
- Time-bound compensation, not indefinite.
Political & Institutional Dimensions
- GST Council: Consensus-based so far (except ~2 votes). Likely to approve reform since announced by PM.
- Potential friction: Product classification disputes (whether certain goods fall in 5% or 18%), timing of implementation, and transitional compensation.
- Consensus outlook: Strong — reforms likely passed in next Council meeting (may require vote, but government has majority).
Macro Implications
- Average GST rate falls to ~10% → competitive with OECD economies.
- Ease of doing business improves: Simple two-rate GST system boosts investor confidence.
- Formalisation accelerates: lower rates + better compliance → more firms enter GST net.
- Revenue trajectory: Dip in Year 1–2, stabilisation by Year 3, higher buoyancy thereafter.
- State fiscal independence: Pushes states to strengthen own tax (property tax, excise, stamp duty) rather than rely on GST transfers.
Summary Judgment:
- Reform = Simplification + Ease of doing business + Long-term revenue buoyancy.
- Short-term revenue dip of ₹45,000–1,00,000 crore inevitable, disproportionately hitting industrialised states.
- Compensation debate: Centre unlikely to extend blanket GST compensation; instead, targeted equalisation fund or special packages may balance inequities.
- Net effect = Moderate tax regime (~10% avg), stronger compliance, higher consumption, improved investor sentiment.
Which sectors are worst hit by tariffs?
Basics of the Tariffs
- Effective date: August 27, 2025.
- Tariff level: Flat 50% additional tariff on imports from India (over existing tariffs).
- Coverage: Broad, covering labour-intensive and manufacturing sectors where U.S. is a major export destination.
- Earlier tariff structure: Most sectors faced 0–10% tariffs; now in many cases, effective duties are 50–60%.
- Metrics of severity (impact analysis):
- Export value to U.S. (absolute terms).
- Share of U.S. in India’s total exports of that product.
- Final tariff rate post-hike.
Relevance : GS 3(Economy – Tariff)
Sectors Facing Severe Impact
(a) Shrimp
- Exports to U.S.: $2.4 billion (2024–25).
- Share: 32.4% of India’s total shrimp exports.
- Tariff jump: 10% → 60%.
- Immediate impact:
- Sharp fall in demand from U.S. buyers.
- Reports of exporters in Andhra Pradesh lowering purchase prices.
- Cancelled contracts and shipment delays.
- High risk for aquaculture farmers and coastal labour.
(b) Textiles & Apparel (Tiruppur cluster etc.)
- Exports to U.S.: $2.7 billion.
- Share: 13.2% of India’s total textile exports.
- Tariff jump: 4% → 54%.
- Immediate impact:
- Exporters rushing existing shipments before duties bite.
- U.S. buyers cancelling fresh orders.
- Threat to jobs in Tiruppur, Surat, Panipat (labour-intensive hubs).
(c) Jewellery, Diamonds & Carpets
- U.S. a top market for India’s gems & jewellery (~$10–12 billion annually, though not all under 50% tariff).
- Impact:
- High-value exports like cut diamonds and studded jewellery hit severely.
- Surat, Jaipur clusters face job & liquidity pressures.
- Reports of production cuts and downsizing.
Sectors Facing Moderate Impact
(a) Metals (Steel, Aluminium, Copper)
- Exports to U.S.: $4.7 billion (17% of total Indian metal exports).
- Impact:
- U.S. not largest global market, but vital for SMEs in Delhi-NCR engineering belt and eastern foundry hubs.
- Stainless steel, aluminium casting, and copper semi-finished goods face job disruptions.
(b) Machinery & Mechanical Appliances
- Exports to U.S.: $6.7 billion (20% of India’s total in this category).
- Impact:
- Demand drop expected, but diversified global buyers soften the blow.
- Still critical for SMEs dependent on U.S. orders.
(c) Organic Chemicals
- Medium exposure to U.S.
- Tariff impact is cushioned by wider markets in EU, Japan, ASEAN.
- Industry body CHEMEXCIL has sought government intervention.
Immediate Economic Impact
- Severe demand shock: shrimp, textiles, jewellery already seeing cancellations.
- Price crash: Shrimp prices falling in Andhra Pradesh procurement markets.
- Employment risk: Labour-intensive sectors (textiles, gems, aquaculture) at risk of layoffs.
- Exporters’ reaction: Pre-shipment rush, appeals to government, lobbying through industry bodies.
Government Response (Short-term)
- “Swadeshi” & “Vocal for Local” narrative: Reduce export dependency; boost domestic demand.
- Multi-ministry plan under consideration (Commerce, Finance, External Affairs, MSME):
- Possible interest subvention / credit support for exporters.
- Export incentive packages for worst-hit sectors.
- Marketing support to explore alternative destinations.
- RBI readiness: Governor stated RBI will provide liquidity or credit easing to impacted sectors.
Medium to Long-term Strategy
- Diversification of export markets:
- Leverage FTAs (UAE, Australia, EU in progress).
- Push into Africa, ASEAN, Latin America.
- Strengthening domestic value chains: Reduce reliance on U.S. orders.
- Special packages/funds: For sectors with high labour absorption (textiles, gems, marine exports).
- Negotiation channels: Possible WTO consultations or bilateral trade talks with U.S.
International Parallels
- Similar protective tariffs by U.S. in past (e.g., Trump-era steel tariffs, China tariffs) caused:
- Short-term export pain.
- Trade diversion to alternate markets.
- Other countries responded with compensation packages for farmers/exporters or by negotiating bilateral deals.
Summary
- High-impact sectors: Shrimp, textiles, jewellery/carpets (tariffs up to 60%, immediate order cancellations, production/job cuts).
- Moderate-impact sectors: Metals, machinery, organic chemicals (tariffs 50%, but diversified export base reduces damage).
- Government response: Short-term relief plan + credit support + long-term diversification strategy.
- Outlook: Immediate pain in labour-heavy sectors, with medium-term adjustment possible if markets diversify and domestic demand strengthens.
School enrolment in 3-11 age group down by 25 lakh: UDISE+
Basics: What is UDISE+?
- Unified District Information System for Education Plus (UDISE+): Annual survey by the Ministry of Education.
- Covers pre-primary to Class 12 in govt., aided, private, and other schools.
- Provides data on enrolment, dropouts, Gross Enrolment Ratio (GER), infrastructure, teachers, etc.
- Latest data: 2024-25, compared to 2023-24.
Relevance : GS 2(Education , Social Issues)
Key Findings of UDISE+ 2024-25
- Sharp fall in young student enrolment (ages 3–11; Anganwadi, pre-school, Classes 1–5):
- 2023-24: 12.09 crore
- 2024-25: 11.84 crore
- Decline: 24.93 lakh students
- Overall enrolment (Classes 1–12):
- 2023-24: 24.8 crore
- 2024-25: 24.69 crore
- Drop: 11 lakh students → lowest since 2018-19.
- Historical trend:
- 2012-13: 26.3 crore
- 2021-22: ~26 crore
- 2022-23: 25.18 crore
- 2023-24: 24.8 crore
- 2024-25: 24.69 crore
- Net fall in a decade: ~1.6 crore students (~6%).
Causes of Decline in Enrolment
- Demographic transition:
- Falling birth rates → shrinking school-age population.
- India’s TFR = 1.91 (2021) < replacement level (2.1).
- Except UP, Bihar, Meghalaya, all states below replacement fertility.
- Shift to standalone pre-primary private institutions → some children outside UDISE+ school count.
- Methodological changes in 2022-23 and 2023-24 → not fully comparable to older datasets.
- Urbanization & migration: Possible undercounting of mobile/migrant children.
Positive Indicators Amid Decline
- Rising GER (Gross Enrolment Ratio):
- Middle level: 89.5% → 90.3% (2023-24 to 2024-25).
- Secondary level: 66.5% → 68.5%.
- Suggests higher share of eligible children are actually enrolled, even if population base shrinks.
- Dropout rates improving:
- Preparatory stage: 3.7% → 2.3%.
- Middle school: 5.2% → 3.5%.
- Secondary: 10.9% → 8.2%.
- Indicates better retention, fewer children leaving school midway.
- Higher enrolment in upper classes:
- Classes 6–8: +6 lakh students (6.31 → 6.36 crore).
- Classes 9–12: +8 lakh students (6.39 → 6.48 crore).
- Suggests progress in transition from primary to secondary education.
Implications of the Decline
- Demographic dividend challenge: Shrinking base of young students → smaller workforce in future.
- Education system planning: Govt. must align teacher recruitment, infrastructure, and budgets with falling school-age population.
- Policy focus shift:
- From universal access → to quality of learning outcomes.
- With fewer children, per-child investment can be higher.
- Regional disparities: States like UP & Bihar (still high fertility) may see continued high demand for schools, while southern & western states face declining enrolment.
- Long-term social impact: Lower child population → ageing society sooner, with implications for pensions, health care, and dependency ratios.
Way Forward
- Use of upcoming 2026 Census: To update school-age population base and refine GER/dropout estimates.
- Policy realignment:
- Rationalizing school infrastructure in low-population areas.
- Investing more in teacher training, digital learning, foundational literacy.
- Focus on early childhood education: Integrate Anganwadis and standalone pre-schools into formal system (NEP 2020 mandate).
- Address regional imbalance:
- Northern states → focus on access (school availability).
- Southern states → focus on retention & higher-order skills.
Centering elderly women: caring for the quiet majority
India’s Ageing Context
- Demographic transition:
- India is moving from a young to ageing society due to falling fertility & rising life expectancy.
- India Ageing Report 2023 (IIPS + UNFPA):
- By 2050, 20%+ of India’s population will be aged 60+.
- This equals ~347 million elderly, compared to ~149 million in 2022.
- Gendered longevity:
- Women live 2.7 years longer than men on average.
- Results in a feminisation of ageing (more elderly women than men).
Relevance : GS 1(Society) , GS 2(Social Issues)
Health & Longevity Gap Between Men and Women
- McKinsey Health Institute:
- Women spend 25% more years in poor health than men.
- Much of this burden falls in later years of life.
- Elderly women’s health paradox:
- Longer life expectancy ≠ better quality of life.
- Higher prevalence of chronic conditions, cancers, and cognitive decline.
Social Determinants of Elderly Women’s Health
- Cultural & social conditioning:
- Women prioritise family health > own health.
- Gatekeeping of care decisions by husband/adult children.
- Economic dependency:
- 60% of elderly women have no personal income (UNFPA 2011).
- <20% women can pay their own medical bills (vs. 44% men).
- Very few elderly women have health insurance.
- Digital divide:
- Limited access to digital health platforms & insurance enrolment.
- Reduces access to information & tele-health solutions.
- Education gap:
- Education strongly linked to better health-seeking behaviour.
- Uneducated women face poor awareness about preventive screenings & therapies.
Disease Burden Among Elderly Women
- Cancer risks:
- Breast cancer: Elderly women often get less aggressive treatment, lowering survival despite effectiveness of surgery/chemo.
- Cervical cancer: Vaccination awareness growing in younger women, but elderly women lack access to pap smear screening.
- Ovarian cancer: Most lethal gynaecological cancer; 5-year survival only 17% if diagnosed late.
- Neurodegenerative diseases:
- Higher vulnerability to Alzheimer’s, dementias (due to oestrogen decline, widowhood, isolation).
- LASI: Women 70+ report higher cognitive impairment, but are under-diagnosed & under-treated.
- Mental health:
- Depression highly under-reported.
- HelpAge India: Only 1 in 10 elderly women with depressive symptoms seek help.
- Barriers: stigma, lack of geriatric psychiatry services, family neglect.
Positive Protective Factors
- Social embeddedness:
- Elderly women deeply connected to family & community networks.
- Protective against loneliness & cognitive decline.
- Active lifestyles:
- Walking groups, yoga, hobbies (painting, music) improve physical & mental well-being.
- Education advantage:
- Educated women are more likely to seek outpatient care, both public & private.
Policy & Systemic Gaps
- Healthcare spending bias:
- Across age groups, health expenditure on men > women.
- Gender-insensitive care:
- Few healthcare facilities tailor care to elderly women’s needs (e.g., cancer screening, mental health).
- Elderly treated as dependents:
- Public discourse ignores elderly women’s agency; sees them only as caregivers or passive dependents.
- Insurance gap:
- Limited geriatric coverage; most elderly women lack health protection schemes.
Way Forward – Recommendations
- Policy realignment:
- Build gender-sensitive geriatric health systems.
- NEP for ageing: integrate elderly women’s health into Ayushman Bharat & state health missions.
- Preventive care expansion:
- Free screening programs for cancers (cervical, breast, ovarian) & cognitive decline.
- Financial inclusion:
- Pensions, micro-insurance, and social security nets for widows & single elderly women.
- Mental health integration:
- Geriatric psychiatry, community counselling, elderly support helplines.
- Digital & health literacy:
- Train elderly women in basic digital health platforms.
- Expand awareness on vaccinations, screening, and treatment options.
- Community-driven solutions:
- Promote elderly women’s groups, SHGs, walking clubs, skill-based learning for social & mental health benefits.