Why in News?
- Cyclone Montha (Oct 2025) recently made landfall along the Odisha–Andhra coast, highlighting the dynamics of tropical cyclone formation, prediction, and intensity estimation in the Indian Ocean.
- Renewed focus on the accuracy of cyclone forecasting, role of wind shear, and satellite-based observation in disaster preparedness.
Relevance
- GS Paper 1 – Geography: Physical geography – climatology, tropical cyclones, atmospheric circulation.
- GS Paper 3 – Disaster Management: Early warning systems, forecasting technologies, and mitigation measures.
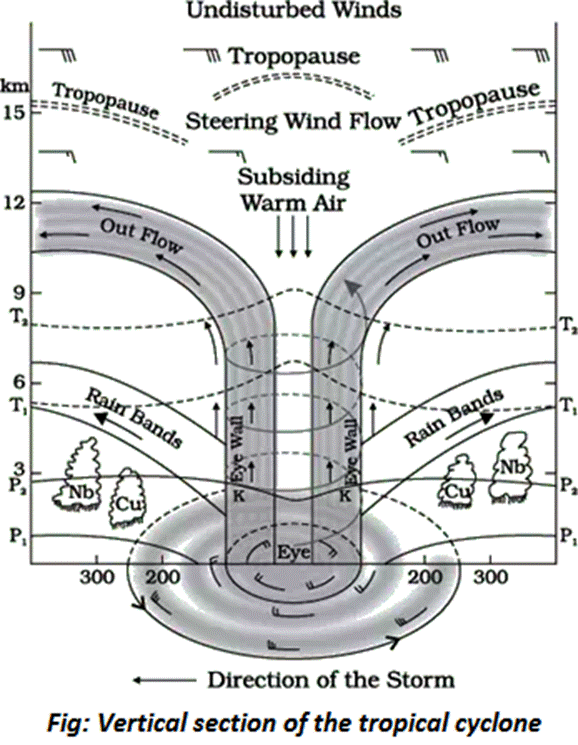
What is a Cyclone? — Basic Definition
- A cyclone is a large-scale, low-pressure weather system characterized by inward-spiraling winds rotating around a central core called the eye.
- Classified by region:
- Hurricanes (Atlantic, NE Pacific)
- Typhoons (NW Pacific)
- Tropical Cyclones (Indian Ocean & South Pacific)
Conditions Required for Cyclone Formation
- Warm Sea Surface Temperature (SST) — above 26.5°C to a depth of ≥50 m for sufficient latent heat.
- Coriolis Force — needed to initiate cyclonic rotation; absent within 5° latitude of the Equator.
- Low Vertical Wind Shear — allows organized upward convection; high shear disrupts circulation.
- Atmospheric Instability — encourages sustained convection and rising of moist air.
- High Humidity — in mid-troposphere (5–7 km) to sustain cloud formation.
- Pre-existing Disturbance — e.g., a low-pressure zone or tropical wave to trigger initial rotation.
Stepwise Process of Cyclone Formation
- Stage 1: Low-pressure area develops → convergence of moist air.
- Stage 2: Rising moist air condenses → releases latent heat, intensifying convection.
- Stage 3: Warm air rises, pressure drops → inflow of more moist air.
- Stage 4: Rotation begins under Coriolis effect → organized cyclonic circulation forms.
- Stage 5: Eye formation and eyewall intensification mark a mature cyclone.
Structure of a Cyclone
| Feature | Description |
| Eye | Central calm zone (20–50 km wide), lowest pressure, clear skies, sinking air. |
| Eyewall | Surrounds the eye; most intense winds & rainfall occur here. Rising convective towers dominate this zone. |
| Rainbands | Outer spiral bands producing intermittent rain and gusts. |
| Outflow | High-altitude air diverging outward, maintaining cyclone balance. |
Role of Wind Shear
- Vertical Wind Shear: Difference in wind speed/direction between lower and upper atmosphere.
- Low Wind Shear: Maintains vertical alignment → cyclone strengthens.
- High Wind Shear: Tilts vortex → disrupts convection → prevents intensification or leads to dissipation.
- Example: Monsoonal shear in Bay of Bengal often limits storm strengthening near the coast.
Observational Methods
- Satellites (Primary Source in Indian Ocean):
- Infrared sensors: Estimate cloud-top temperatures → proxy for intensity.
- Visible imagery: Identifies eye formation and structure.
- Microwave sensors: Reveal rainfall distribution & internal dynamics.
- Scatterometers: Measure surface wind speeds over oceans.
- Ocean Buoys: Record SST, pressure, wind speed, and humidity.
- Ground-based Observations: Weather radars, coastal stations, Doppler radars track approach and landfall.
- Aircraft Reconnaissance (“Hurricane Hunters” – Atlantic):
- Fly into storms to record wind, temperature, humidity, and pressure.
- Deploy dropsondes—instruments that transmit vertical profiles of atmospheric data while descending.
Cyclone Classification (IMD – North Indian Ocean)
| Category | Wind Speed (km/h) |
| Low Pressure Area | <31 |
| Depression | 31–49 |
| Deep Depression | 50–61 |
| Cyclonic Storm | 62–88 |
| Severe Cyclonic Storm | 89–117 |
| Very Severe Cyclonic Storm (VSCS) | 118–165 |
| Extremely Severe Cyclonic Storm (ESCS) | 166–220 |
| Super Cyclonic Storm | ≥221 |
Cyclone Forecasting & Modeling
- Forecasting Challenges:
- Small initial data errors → large track/intensity deviations.
- Ocean–atmosphere coupling adds complexity.
- Tools Used:
- Numerical Weather Prediction (NWP) models assimilating global data.
- Dynamic models (e.g., ECMWF, GFS) simulate track, intensity, and rainfall.
- IMD’s INCOIS & MOSDAC systems integrate satellite + ocean buoy data.
- Forecast Accuracy:
- Track prediction improved to 3–5 days in advance with high confidence.
- Intensity prediction remains less accurate (error ~15–25%).
Broader Analysis
- Improved Preparedness: Post-1999 Odisha super cyclone, India established IMD’s Regional Specialized Meteorological Centre (RSMC) and INSAT-based alert systems.
- Disaster Risk Reduction: Cyclone shelters, early warning dissemination, and community resilience have reduced mortality rates drastically.
- Climate Link: Warming oceans → increase in frequency of Very Severe Cyclones (VSCS), though total cyclone count remains stable.
- Data Gap: Absence of reconnaissance flights in Indian Ocean affects real-time accuracy; dependence on satellite estimates continues.
Conclusion
- Cyclones are heat engines of the tropics, driven by oceanic and atmospheric interactions.
- While track prediction has achieved notable precision, intensity estimation still faces uncertainty due to high wind shear, sea temperature variability, and data resolution.
- Sustained investment in ocean monitoring, AI-based modeling, and regional cooperation (like BIMSTEC & ESCAP) is essential for enhanced cyclone resilience.


