Content
- Horticulture: Strengthening India’s Agri-Economy
- India’s GDP Surge: Driving the Growth Story
Horticulture: Strengthening India’s Agri-Economy
Introduction
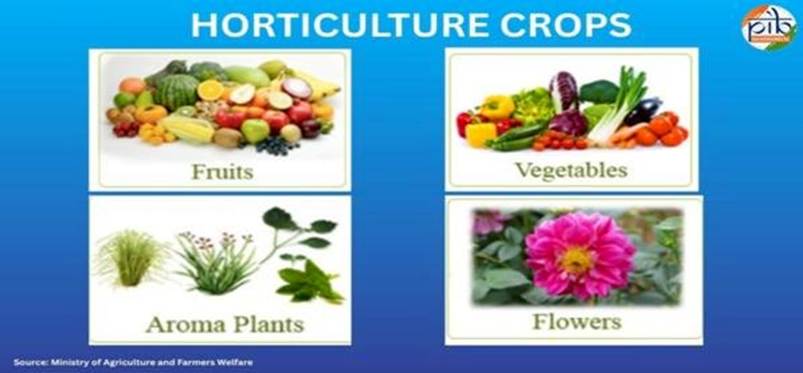
- Horticulture covers fruits, vegetables, flowers, spices, plantation crops, tubers, and medicinal plants.
- India: 2nd largest producer of fruits & vegetables globally (after China).
- Sector’s significance:
- Enhances nutritional security.
- Provides high-value income compared to cereals.
- Generates year-round employment.
- Promotes crop diversification and export potential.
- Case Studies:
- Kerala: Coconut-based mixed farming → ₹14–15 lakh/yr.
- Assam: Floriculture (Gladiolus, Tube Rose, Gerbera) → Income doubled vs cereals.
Relevance : GS 3(Agriculture , Indian Economy)
Growth Trends (Data-Driven)
- Production growth:
- 2013–14 → 280.7 MT
- 2024–25 → 367.7 MT (+31%).
- Fruits:
- 2014–15 → 866 LMT
- 2023–24 → 1129.7 LMT (+30%).
- Productivity: 14.17 → 15.80 MT/ha.
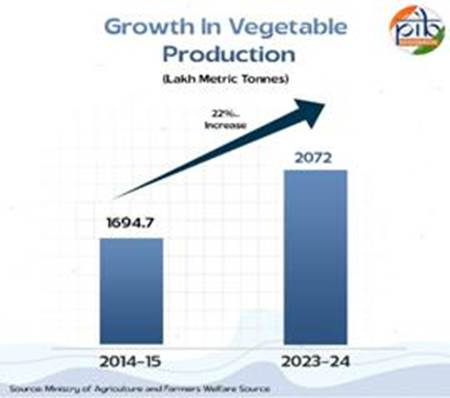
- Vegetables:
- 2014–15 → 1694.7 LMT
- 2023–24 → 2072 LMT (+22%).
- Productivity: 17.76 → 18.40 MT/ha.
Strategic Role
- Doubling Farmers’ Income Committee (2016) → identified horticulture diversification as key.
- Shifts farmers from subsistence to commercial crops.
- Supports export earnings: India’s share in global spice, mango, banana, cashew exports significant.
- Encourages women and youth participation (labour-intensive sectors like floriculture & nurseries).
Government Schemes & Institutional Mechanisms
Mission for Integrated Development of Horticulture (MIDH, 2014–15 onwards)
- Umbrella scheme, includes NHM, HMNEH, NHB, CDB, CIH.
- Key interventions:
- Centres of Excellence (training, tech transfer).
- Cluster Development Programme (market-led growth).
- Clean Plant Programme (disease-free planting material).
- Post-Entry Quarantine Facilities (imported germplasm).
- Infrastructure support (polyhouses, packhouses, cold chain, ripening chambers).
National Horticulture Mission (NHM, 2005–06)
- Cluster-based, state-driven.
- Focus: Planting material, productivity, modern tech, training, PHM.

Horticulture Mission for North East & Himalayan States (HMNEH, 2001–02)
- Coverage: NE states + Himachal, J&K, Uttarakhand.
- Merged into MIDH after 2014–15.
National Horticulture Board (1984)
- Promotes high-tech commercial horticulture, cluster hubs, cold chains.
Coconut Development Board (1981)
- Focus: Productivity, value addition, by-product utilization.
Central Institute of Horticulture, Nagaland (2006)
- Capacity building, training in NE states.
Financial & Technical Support
- Nurseries, tissue culture units → quality planting material.
- Protected cultivation (polyhouses, greenhouses) → off-season crops.
- Organic farming & certification.
- Water management structures (ponds, drip irrigation).
- Beekeeping promotion → pollination services.
- Mechanisation → efficiency, labour reduction.
- Post-Harvest Management (PHM) → cold chain, processing, refrigerated transport.
Research & Quality Improvement
- ICAR & SAUs: varietal development, stress-tolerant crops.
- NARS system: dissemination of improved horticultural technologies.
- Example: banana tissue culture, mango hybrid varieties, spice quality improvement.
Challenges
- Post-harvest losses: 25–30% of fruits & vegetables wasted due to poor storage & logistics.
- Market volatility: prices fluctuate seasonally (e.g., onion, tomato).
- Small holdings: difficult to adopt high-tech horticulture.
- Climate vulnerability: fruits & vegetables sensitive to erratic rainfall & temperature.
- Input costs: high for polyhouses, tissue culture, cold storage.
- Export barriers: stringent SPS standards in EU/US markets.
Way Forward
- Strengthen farm-to-fork value chains with robust cold chains.
- Promote horticulture clusters (similar to textile clusters).
- Encourage FPOs & cooperatives → collective bargaining, branding.
- Scale up GI tagging & branding (e.g., Nagpur Orange, Darjeeling Tea).
- Expand horticulture exports under APEDA support.
- Focus on nutri-horticulture to combat malnutrition (kitchen gardens, school mid-day meals).
- Public–Private Partnerships (PPP) in processing & logistics.
- Encourage climate-smart horticulture (drought-tolerant fruit varieties, micro-irrigation).
Conclusion
- Horticulture is no longer a “supplementary activity” but a pillar of India’s agri-economy.
- It provides 4x–10x higher returns compared to cereals per hectare.
- With government support, R&D, market access, and export facilitation, India can become a global horticulture powerhouse.
- True potential: Linking productivity gains + post-harvest management + market reforms → sustained farmer prosperity.
India’s GDP Surge: Driving the Growth Story
Basics of GDP
- Definition: GDP = total monetary value of all final goods & services produced within a country’s borders in a given period.
- Types:
- Nominal GDP: measured at current market prices (includes inflation).
- Real GDP: adjusted for inflation, shows true growth.
- Per Capita GDP: GDP ÷ population, reflects average income.
- Other Metrics:
- GVA (Gross Value Added) = GDP – Net Indirect Taxes (better indicator of supply-side performance).
- IIP (Index of Industrial Production) = short-term indicator of industrial activity.
Relevance : GS 3(Indian Economy)
Current Growth Performance (Q1 FY 2025–26)
- Real GDP Growth: 7.8% (₹47.89 lakh cr) vs. 6.5% last year (₹44.42 lakh cr).
- Sectoral Contributions:
- Primary (Agri, mining, forestry, livestock) → 3.7% (vs. 1.5% last year).
- Secondary (Manufacturing, utilities, construction) → 7.6–7.7%.
- Tertiary (Services) → 9.3% (highest, vs. 6.8% last year).
- GVA Growth: 7.6% in April–June 2025 → indicates broad-based expansion.
- Demand Drivers: Strong private consumption, rural rebound, and rising investment.
Medium & Long-Term Outlook
- India’s Position: 4th largest economy now → projected 3rd largest by 2030 ($7.3 trillion GDP).
- Milestones:
- $5 trillion by 2027.
- Surpassing Germany by 2028.
- Drivers: Decisive reforms, demographic dividend, digitalisation, investment-led growth.
Industrial Production (IIP, July 2025)
- IIP Growth: 3.5% (vs. 1.5% in June 2025).
- Key Contributors:
- Electrical equipment: +15.9%.
- Basic metals: +12.7%.
- Non-metallic mineral products: +9.5%.
- Significance: Revival of manufacturing signals stronger job creation + CAPEX-led expansion.
Tax & Formalisation – GST
- Introduced: 2017 (subsume multiple indirect taxes).
- Structure: 4 slabs (5%, 12%, 18%, 28%).
- Status (2025):
- 1.52 crore active GST registrations.
- ~50% registrations from UP, Maharashtra, Gujarat, TN, Karnataka.
- Women-led participation: 20% taxpayers have a woman member; 14% fully women-owned.
- Impact: Formalisation, price convergence, interstate trade efficiency.
- Next-gen GST reforms (Oct 2025): Simplify MSME compliance, reduce tax on essentials, enhance transparency.
Capital Expenditure (CAPEX)
- 2024–25: ₹10.52 trillion CAPEX (higher than revised estimates).
- CAPEX to Revenue Exp. Ratio: >0.27 for 3 consecutive years (vs. pre-COVID avg. ~0.14).
- Impact: Long-term asset creation, productivity gains, job generation.
- Government Push: PM GatiShakti + infrastructure pipeline → logistics boost.
Consumption & Demand
- PFCE (Private Final Consumption Expenditure): +7% in Q1 FY26 (rural rebound key).
- GFCE (Govt. consumption): +9.7% vs. 4% last year → fiscal support aiding demand.
- Rural Demand: Strengthened by good harvest, food inflation easing, wage growth.
Inflation Trends (CPI, July 2025)
- Headline CPI Inflation: 1.55% (lowest since June 2017).
- Food Inflation: –1.76% (deflation, lowest since Jan 2019).
- Core Inflation: ~3.9% (stable).
- RBI Target: 4% ± 2% → inflation well within band for 3 consecutive quarters.
- Drivers of Decline: Good monsoon, buffer food stocks, base effects, stable energy prices.
Employment Dynamics
- Jobs Created: 17 crore in last decade.
- LFPR (15+ years): 49.8% (2017–18) → 60.1% (2023–24).
- Female LFPR: 23.3% → 41.7%.
- Unemployment Rate:
- 6% (2017–18) → 3.2% (2023–24).
- July 2025: 5.2% (rural 4.8%, urban 6.8%).
- Sectoral Shifts:
- Agriculture → 19% job growth.
- Services → 36% job growth.
- Manufacturing → 15% job growth (vs. 6% in 2004–14).
- Self-Employment: Dominant in rural areas (>55%).
- Schemes: PM Viksit Bharat Rozgar Yojana (2025–27 target: 3.5 crore youth).
Investments & External Sector
- FDI: $81 billion (FY25).
- Target: $100 billion annual inflows.
- Cumulative (2000–2024): $1.05 trillion.
- Forex Reserves: $695.5 billion (July 2025).
- FIIs & DIIs: Both large net buyers (DIIs ₹44,269 cr; FIIs ₹33,336 cr, June–July 2025).
Global Perception & Ratings
- IMF: 6.4% GDP growth forecast (2025 & 2026).
- UN: 6.3% (2025), 6.4% (2026).
- S&P (2025): Sovereign rating upgraded to BBB (from BBB-) after 18 years.
- Fitch: Retained BBB- (stable outlook).
- Implication: Improved investor confidence, lower borrowing costs.
Schemes Driving the Growth
- PLI Scheme (2020): ₹1.97 lakh cr outlay; attracted ₹1.76 lakh cr investment across 14 sectors.
- Digital India: Internet users up from 25 cr (2014) → 97 cr (2024). Bharat 6G vision ongoing.
- PMJDY: 56 cr bank accounts; 55% women-led. Backbone of DBT.
- Make in India: Mobile manufacturing success (2 factories in 2014 → 300+ in 2024).
- Skill India & Rozgar Yojana: 6 cr trained; 3.5 cr jobs targeted (2025–27).
- GeM: ₹15 lakh cr in transparent govt procurement.
- National Logistics Policy & PM GatiShakti: Logistics cost reduction, connectivity boost.
Challenges
- Uneven job quality: high self-employment, informal jobs.
- Rural–urban income divide persists.
- Private investment revival still cautious vs. public CAPEX.
- Global headwinds: energy shocks, geopolitical risks.
- Export competitiveness: supply-chain bottlenecks, FTAs pending.
Conclusion
- India’s 7.8% GDP growth in Q1 FY26 confirms broad-based resilience.
- Drivers: Robust services, manufacturing momentum, inflation control, strong domestic demand, and reform-driven investment.
- Outlook: India poised to become 3rd largest economy by 2030 ($7.3 trillion GDP).
- Success depends on sustained reforms, inclusive job creation, export competitiveness, and climate-resilient growth under Viksit Bharat 2047 vision.


