Content
- India’s Manufacturing Momentum: Performance and Policy
- Strengthening Homes, Lives & Jobs
India’s Manufacturing Momentum: Performance and Policy
Basics
- Index of Industrial Production (IIP): Tracks output of manufacturing, mining, and electricity sectors; proxy for industrial growth.
- Manufacturing Purchasing Managers’ Index (PMI): Survey-based indicator reflecting business activity, new orders, output, and employment trends in manufacturing.
- Flagship Policies Driving Manufacturing:
- PLI Scheme (2020): ₹1.97 lakh crore outlay, incentives for incremental production across 14 sectors.
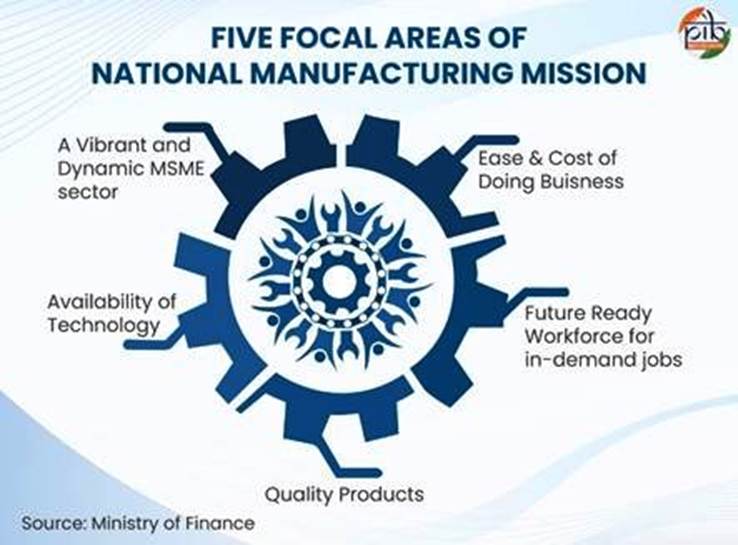
- National Manufacturing Mission (2025–26): Unified, long-term industrial policy focusing on sustainability, clean-tech, and global leadership.
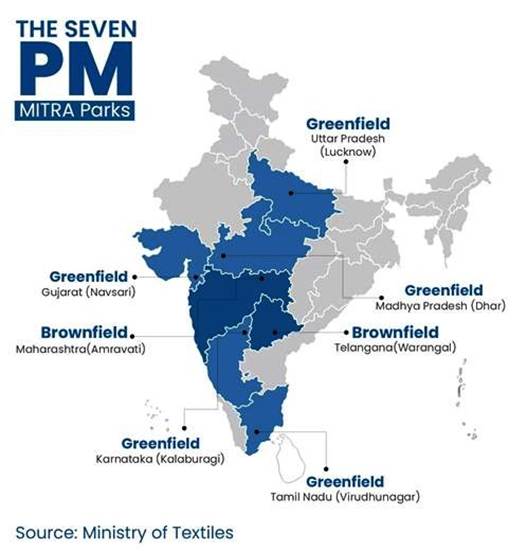
- PM MITRA Parks: Mega textile hubs to attract investment and create jobs.
- Skill India Restructuring (2025): ₹8,800 crore outlay for demand-driven skill alignment.
- National Logistics Policy (2022): Reduce logistics costs, boost efficiency, integrate digital systems.
- Startup India (2016): Strengthening entrepreneurship as a growth driver.
Relevance :
- GS3 (Economy): Industrial growth, PLI, exports, MSMEs, job creation.
- GS3 (Infrastructure): Industrial/logistics corridors.
- GS3 (S&T/Environment): EVs, clean-tech, Net Zero.
Overview
Recent Performance Indicators
- IIP Growth:
- July 2025: 3.5% YoY (vs. 1.5% in June).
- Manufacturing: 5.4% YoY (vs. 3.7% in June).
- Sectoral Leaders (July 2025):
- Electrical equipment (+15.9%), basic metals (+12.7%), non-metallic minerals (+9.5%).
- PMI Surge:
- June 2025: 58.4 → July: 59.1 → August: 59.3 (highest in 17 years).
- Driven by fastest production growth in 5 years, strong factory orders, hiring expansion.
Exports & Global Value Chains
- Exports April–Aug 2025:
- Total exports: $349.35 bn (+6.18% YoY).
- Merchandise exports: $184.13 bn (+2.52% YoY).
- Target: $1 trillion manufacturing output by FY26; contribute $500 bn annually to global economy by 2030.
- Strategic Sectors Anchoring Exports: Electronics, pharma, automobiles, textiles.
Sectoral Engines of Growth
a) Electronics (Digital Factory Floor)
- Production: ₹1.9 lakh cr (2014–15) → ₹11.3 lakh cr (2024–25).
- Exports: ₹38,000 cr → ₹3.27 lakh cr (8x increase).
- Mobile phones:
- Production: ₹18,000 cr → ₹5.45 lakh cr (28x).
- Exports: ₹1,500 cr → ₹2 lakh cr (127x).
- Import dependence: 75% → 0.02%.
- Now world’s second-largest mobile manufacturer; FDI inflows $4 bn (70% via PLI).
b) Pharmaceuticals (Pharmacy of the World)
- Global share: 50% vaccines, 40% generics (to US).
- Production rank: 3rd by volume, 14th by value.
- Target: $130 bn (2030), $450 bn (2047).
- PLI (₹15,000 cr): 55 projects, focus on high-value drugs.
- SPI (₹500 cr): Quality upgradation, R&D support for SMEs.
c) Automobiles (Shifting into High Gear)
- Contribution: 7.1% of GDP, 49% of manufacturing GDP.
- FY25: 3.10 crore vehicles produced.
- Global standing: 4th largest automobile producer.
- EV push under PLI & FAME schemes positioning India in future mobility.
d) Textiles (Inclusive Growth Driver)
- Contribution: 2.3% of GDP, 13% of industrial production, 12% of exports.
- Target: $350 bn industry by 2030, 3.5 crore jobs.
- Employment: 45 mn directly (majority women, rural).
- PM MITRA Parks: 7 approved; Dhar, MP inaugurated (Sept 2025) → 1,300 acres, 80 units, 3 lakh jobs expected.
Investment Flows & FDI Confidence
- Total FDI inflows (2014–25): $748.78 bn (143% ↑ vs 2003–14).
- FY25: $81.04 bn (14% ↑ YoY).
- Manufacturing FDI: $19.04 bn (18% ↑ YoY).
- Top states: Maharashtra (39%), Karnataka (13%), Delhi (12%).
- Top sources: Singapore (30%), Mauritius (17%), USA (11%).
- Target: Raise annual inflows to $100 bn.
Employment, Skills & Human Capital
- Job creation: 17 crore jobs in last decade; 15% growth in manufacturing jobs (vs. 6% in 2004–14).
- PLFS Aug 2025:
- WPR: 52.2%.
- Female WPR: 32% (rising steadily).
- LFPR (women): 33.7%.
- UR: 5.1%; male UR at 5.0% (5-month low).
- Skill India Revamp (₹8,800 cr): Integrated PMKVY 4.0, Apprenticeship, Jan Shikshan into one demand-driven, industry-aligned system.
Policy Catalysts
- PLI Scheme: Transforming 14 key sectors; boosting exports (e.g., smartphones > ₹1 lakh cr exports in 5 months of FY26).
- GST 2.0 Reforms: Two-slab structure; rate cuts on essentials, auto, textiles, logistics → cost compression, MSME competitiveness, export boost.
- National Logistics Policy (2022): Reduce costs, digitalize logistics, improve India’s LPI rank.
- Industrial Corridors: 12 new projects (₹28,602 cr) → integrated urban-industrial hubs.
- Startup India: 1.91 lakh DPIIT-recognised startups; 17.69 lakh direct jobs created.
Road Ahead: From Momentum to Leadership
- Amrit Kaal 2047 Goal: $35 trillion economy; manufacturing at its core.
- Target: Raise manufacturing share in GDP significantly; become global leader in innovation-driven manufacturing.
- Strategic Positioning: Amid global supply chain realignments, India has a window of opportunity to emerge not just as the “factory of the world” but as an innovation and leadership hub.
- Sustainability Focus: National Manufacturing Mission aligning industrial expansion with Net Zero 2070 goals.
Strengthening Homes, Lives & Jobs
Basics
- Context: On 19 September 2025, the Government of India reduced GST rates on key construction inputs and services.
- Objective: Make housing and infrastructure more affordable, strengthen MSMEs, boost jobs, and support Housing for All.
- Flagship Alignment: PMAY-Urban (2015), PMAY-Grameen (2016), Smart Cities Mission, and broader infrastructure goals.
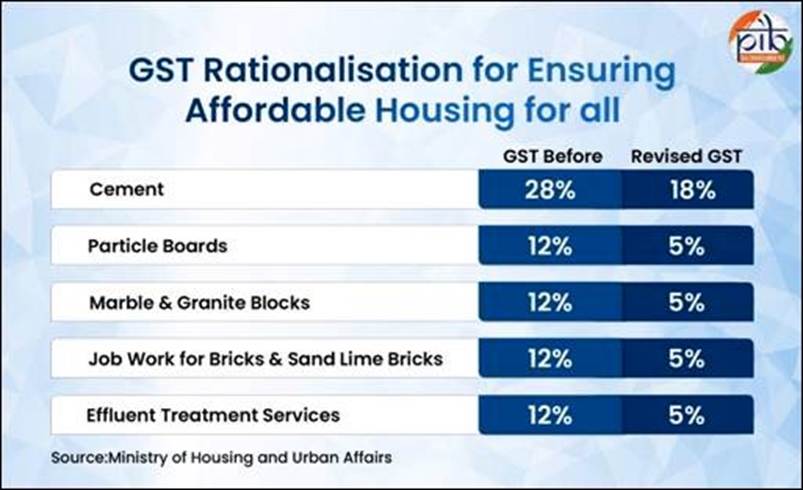
- Key Materials Covered:
- Cement: 28% → 18%
- Particle boards: 12% → 5%
- Marble & granite blocks: 12% → 5%
- Job work for bricks & sand lime bricks: 12% → 5%
- Effluent treatment services: 12% → 5%
Relevance :
- GS3 (Economy): GST reform, housing affordability, MSME relief, jobs.
- GS3 (Infrastructure): Housing & urban development.
- GS3 (Environment): Sustainable construction materials, effluent treatment.
Overview
Cement (28% → 18%)
- Cost Impact: Cement = 15–20% of total building cost, ~11% of overall construction costs → direct reduction in house and infrastructure cost.
- Social Impact: Supports PMAY, rural housing, and public projects (schools, health centers, metro, roads).
- Economic Impact: Boosts demand across cement value chain (mining, logistics, distribution).
- Employment: High labor intensity → more jobs in manufacturing, transport, and construction.
- Fiscal Efficiency: Lower cement costs → public spending efficiency rises as projects stretch further.
Particle Boards (12% → 5%)
- Sectoral Role: Key in prefabricated housing, furniture, rural/urban interiors.
- Sustainability: Jute-based boards = biodegradable, renewable → aligns with India’s climate goals.
- MSME Link: Cluster-based industry → lower GST reduces working capital pressure, boosts small enterprises.
- Employment: Expands semi-urban and rural employment opportunities.
Marble & Granite Blocks (12% → 5%)
- Industry Base: States like Rajasthan, Gujarat, Karnataka, Andhra Pradesh.
- Consumer Benefit: Flooring, tiling, interiors cheaper for middle-class and affordable housing.
- Trade Impact: Strengthens domestic stone industry, reduces reliance on imports.
- Jobs: Sustains lakhs in quarrying, cutting, polishing, logistics.
Bricks & Sand Lime Bricks (12% → 5%)
- Brick Job Work: MSME-driven kilns get relief → lowers rural housing costs.
- Sand Lime Bricks: Cheaper → more competitive than traditional red bricks.
- Technical benefits: Strength, uniformity, eco-friendly.
- Rural Impact: Promotes pucca housing adoption in villages under PMAY-Grameen.
- MSME Health: Lower tax = reduced compliance burden + better cash flow.
Effluent Treatment Services (12% → 5%)
- Industrial Impact: Incentivises CETPs → affordable for industries, reduces pollution.
- Urban Governance: Helps municipalities with waste management, clean energy.
- Green Jobs: Creates employment in segregation, plant operation, maintenance.
- Sustainability: Direct contribution to India’s environmental commitments (SDGs, NDCs).
Macro-Economic and Policy Impact
- Housing for All: Directly reduces cost barriers for both urban and rural households.
- MSME Strengthening: Relief across cement, particle board, brick kilns → improves sectoral resilience.
- Employment: Construction = second largest employment generator → multiplier effect across mining, logistics, finishing sectors.
- Investment Boost: Lower input costs attract private investment in construction, real estate, and urban infrastructure.
- Sustainability Push: Eco-materials (jute boards, sand lime bricks) + CETP adoption = greener housing ecosystem.
Strategic Relevance
- Urbanisation Drive: India will add ~400 million urban dwellers by 2050 → affordable housing is crucial.
- Social Equity: Lowers financial burden for EWS, LIG households under PMAY.
- Inclusive Growth: Balances industrial competitiveness, rural employment, and green transitions.
- Long-Term Vision: GST rationalisation is part of larger housing reforms → infrastructure-led growth, improved quality of life.


