Content
- National Co-operative Exports Limited (NCEL)
- Environmental Accounting on forest 2025
National Co-operative Exports Limited (NCEL)
Context
- Definition: NCEL is a national-level multi-state cooperative society focused on exports.
- Legal foundation: Registered under Multi-State Co-operative Societies Act, 2002 (25 January 2023).
- Promoters: IFFCO, KRIBHCO, NAFED, GCMMF (Amul), NCDC.
- Capital structure:
- Initial paid-up capital: ₹500 crore (₹100 crore each by 5 promoters).
- Authorised share capital: ₹2,000 crore.
- Vision: “Taking India’s Cooperative Strength to World Markets.”
- Guiding principle: Sahakar se Samriddhi (Prosperity through cooperation).
Relevance :
- GS II (Governance): Cooperative federalism, Multi-State Co-op Act, govt. policy (“Sahakar se Samriddhi”).
- GS III (Economy): Agri-exports (rice, shrimp, sugar), logistics, rural employment, market diversification.
Functions and Role
- Export surplus produce of cooperatives.
- Activities covered: procurement → storage → processing → packaging → branding → certification → marketing.
- Additional support: financing, technical guidance, skills training, market intelligence, linkage with govt. schemes.
- Acts as a nodal agency for co-operative exports.
Membership Expansion (till Aug 2025)
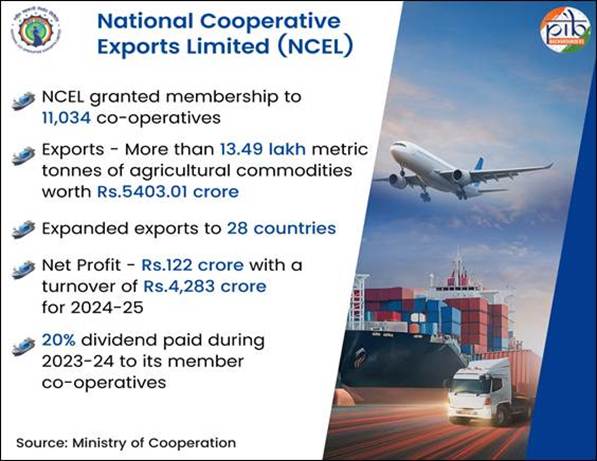
- Total members: 11,034 co-operatives.
- PACS & other primary coops: 10,793.
- Tehsil/District-level coops: 216.
- Multi-state societies: 10.
- State-level societies: 10.
- Promoters: 5.
Export Performance
- Total exports (Jan 2023 – Aug 2025): 13.49 LMT worth ₹5,403 crore.
- Year-wise:
- 2023–24: 2.66 LMT worth ₹1,113.13 crore.
- 2024–25: 10.83 LMT worth ₹4,283.56 crore.
- 2025 (till Aug): 0.00798 LMT worth ₹6.32 crore.
- Products exported: Rice (basmati & non-basmati), marine products (shrimp), coarse cereals, wheat, fruits, vegetables, spices, sugar, tea, animal products, processed food.
- Markets: 28 countries.
- Profitability: Net profit ₹122 crore; turnover ₹4,283 crore in 2024–25.
- Dividend: 20% paid to members in 2023–24.
- MoUs signed: 61 importers from Senegal, Indonesia, Nepal.
Objectives & Key Targets
- Position NCEL as umbrella export body for cooperatives.
- Provide internationally benchmarked prices for agri & allied exports.
- Develop infrastructure & logistics for cooperatives.
- Build branding, packaging, certification capacity.
- Generate rural employment through value addition & export linkages.
- Act as knowledge hub: research, consultancy, training, market intelligence.
Strategies Adopted
- MoUs with state nodal agencies; business plans linked to PACS.
- Commodity seminar series (first in Madhya Pradesh, July 2025).
- Whole-of-Government approach: coordination with RCS, state govts.
- Branding & outreach: social media, digital tools, awareness campaigns.
- BPO outreach programme: expand PACS membership.
- Grassroots mobilisation: Nukkad Natak, multilingual newsletters (10 languages) via WhatsApp/website.
Future Directions
- Expansion of commodity basket: sugar (co-op sugar mills), aromatic rice (Tripura), organic cotton, coarse grains.
- New markets: Gulf (fresh vegetables, potato varieties), Africa & Myanmar (pulses imports).
- Infrastructure growth: establish NCEL offices abroad.
- Technology integration: dedicated portal for demand-supply mapping.
- Government target:
- ₹2 lakh crore exports in coming years.
- Route all co-op exports through NCEL for turnover ₹20,000–30,000 crore.
Significance
- For farmers: Better prices, assured markets, reduced dependence on middlemen.
- For cooperatives: Dividend returns, economies of scale, global visibility.
- For economy: Boosts Make in India, creates rural employment, strengthens agri-exports.
- For governance: Embeds cooperative model into India’s global trade strategy.
Critical Analysis
- Strengths:
- Strong promoter base (IFFCO, Amul, NAFED).
- Government backing ensures credibility.
- Integrated support system (finance + branding + logistics).
- Profit & dividend sharing ensures member participation.
- Challenges:
- Export competitiveness vs. private sector and global cooperatives.
- Need for quality compliance (WTO, Codex standards, SPS/TBT measures).
- Infrastructure bottlenecks (cold chains, ports).
- Risk of politicisation of cooperative movement.
- Dependence on agri-commodities → vulnerability to monsoon, price volatility.
- Opportunities:
- Rising demand for organic, fair-trade, ethnic products abroad.
- Leveraging Indian diaspora markets.
- Linking NCEL with Digital India & e-commerce for exports.
- Strategic partnerships with Gulf, ASEAN, and Africa for food security.
Conclusion
- NCEL has emerged as a game-changer for India’s cooperative movement, giving it global reach.
- Within 2 years, it has shown profitability, large membership, and significant exports.
- The next phase will test its ability to scale up exports, diversify products, and compete internationally.
- If managed efficiently, NCEL could become the global brand ambassador of India’s cooperative model, directly contributing to rural prosperity and India’s export ambitions.
Environmental Accounting on forest 2025
Basics
- Publisher: Ministry of Statistics and Programme Implementation (MoSPI).
- Framework: Based on UN System of Environmental-Economic Accounts (SEEA) – adopted by India in 2018.
- Publication: Environmental Accounting on Forest – 2025 (released 25 Sept 2025 at 29th CoCSSO, Chandigarh).
- Nature: First dedicated publication on forest accounts in India under SEEA framework.
- Structure: Two volumes:
- Vol. I: Methodology + National-level forest ecosystem accounts.
- Vol. II: State/UT-level accounts (decadal changes, case studies, literature review).
- Primary Data Source: India State of Forest Report (ISFR).
- Other Sources: Forestry Statistics 2021 (ICFRE), SEEA frameworks, NCAVES Report, National Accounts Statistics.
Relevance :
- GS III (Environment & Economy): Green GDP, forest conservation, carbon retention (2.63% of GDP), UN SEEA, SDGs.
- GS II (Governance): Evidence-based policymaking, state-level data, MoSPI role.
Accounts Covered (SEEA Framework)
- Physical Asset Accounts → Area under different forest cover categories over time.
- Extent Accounts → Distribution & changes in ecosystem extent (Recorded Forest Area).
- Condition Accounts → Characteristics & quality (growing stock, forest health).
- Service Accounts → Economic valuation of services:
- Provisioning: Timber, Non-timber products.
- Regulating: Carbon retention, climate regulation.
- Cultural: Non-material benefits.
Key Findings
Physical Asset Account
- 2010–11 to 2021–22: Forest cover grew by 17,444.61 sq. km (+22.50%).
- Total cover (2021–22): 7.15 lakh sq. km (21.76% of geographical area).
- Major gains:
- Kerala: +4,137 sq. km.
- Karnataka: +3,122 sq. km.
- Tamil Nadu: +2,606 sq. km.
Extent Account
- 2013–2023: Net increase of 3,356 sq. km (largely due to reclassification & boundary changes).
- RFA share rises:
- Uttarakhand: +6.3%.
- Odisha: +1.97%.
- Jharkhand: +1.9%.
Condition Account
- Growing stock (volume of usable wood):
- +305.53 million cum (↑7.32%) during 2013–2023.
- Major contributors:
- Madhya Pradesh: +136 million cum.
- Chhattisgarh: +51 million cum.
- Telangana: +28 million cum.
- Andaman & Nicobar Islands (UT): +77 million cum.
Services Account
Provisioning services
- Timber + Non-timber value: ₹30.72 → ₹37.93 thousand crore (2011–12 to 2021–22).
- Contribution to GDP (2021–22): 0.16%.
- Top states:
- Maharashtra: ₹23.78k crore.
- Gujarat: ₹14.15k crore.
- Kerala: ₹8.55k crore.
Regulating services (Carbon retention)
- Value: ₹409.1 → ₹620.97 thousand crore (2015–16 to 2021–22) (+51.82%).
- Share of GDP (2021–22): 2.63%.
- Top contributors:
- Arunachal Pradesh: ₹296k crore.
- Uttarakhand: ₹156.6k crore.
- Assam: ₹129.96k crore.
Significance
- Policy integration: Bridges environmental statistics with national accounts → enables Green GDP.
- Climate commitments: Strengthens India’s reporting under NDCs & carbon neutrality targets.
- State-level insights: Helps states track forest wealth & ecosystem service valuation.
- Economic recognition: Quantifies forests’ role in GDP, livelihoods, and sustainability.
- Global alignment: Puts India in sync with UN SEEA & SDG monitoring.
Critical Analysis
- Strengths:
- First comprehensive forest accounting at national + state levels.
- Covers physical, ecological & economic aspects.
- Links forests with GDP and climate mitigation value.
- Provides state benchmarks for policy & investment.
- Challenges:
- Heavy reliance on ISFR → possible methodology inconsistencies.
- Underrepresentation of cultural & biodiversity services.
- Valuation depends on assumptions → subject to contestation in policy circles.
- Forest quality vs. quantity gap – plantation vs. natural forests not always differentiated.
- Opportunities:
- Integrate with carbon markets & natural capital accounting.
- Use for compensatory afforestation & ESG investments.
- Strengthen decentralized planning (Panchayats, States).
- Position India as a leader in natural capital accounting globally.
Conclusion
- The Environmental Accounting on Forest 2025 marks a milestone in India’s environmental-economic integration.
- It quantifies forest assets, conditions, and services, highlighting their significant contribution to GDP & climate goals.
- Going forward, it can guide evidence-based policy, bolster India’s green growth strategy, and ensure forests are recognized as natural capital.


