Why in News ?
- Event: World Meteorological Organization (WMO) released data showing a record rise in global CO2 concentrations between 2022 and 2024.
- Key highlights:
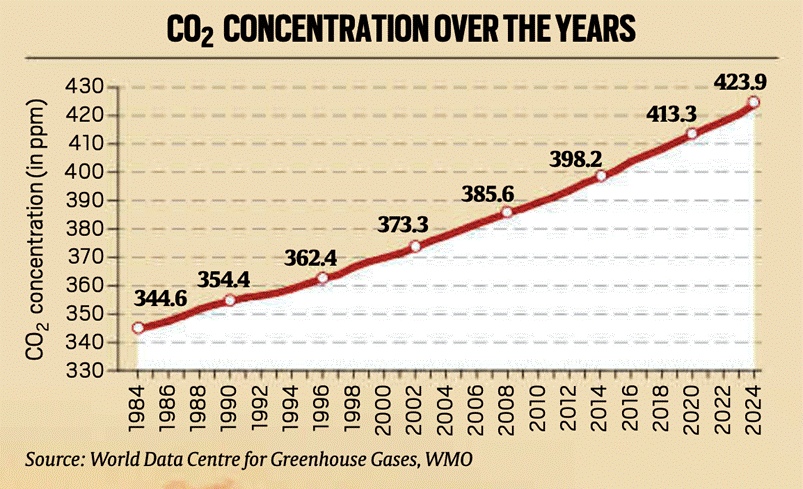
- Global average CO2: 423.1 ppm in 2024, up 2.9 ppm from 2023.
- Increase since 1990: +51.4 ppm.
- Global temperature: 2024 was the warmest year on record, 1.55°C above pre-industrial levels.
- First time the 1.5°C annual average threshold was crossed, a key climate benchmark.
Relevance:
- GS-3: Environment – Climate change trends, GHG emissions, Global warming, Renewable energy imperatives.
- GS-2: Governance – International climate governance, Policy responses, Multilateral coordination (UNFCCC, WMO).
- GS-1: Society – Impact on livelihoods, Migration, and human security.
Understanding CO2 and Greenhouse Gases ?
- CO2 as a greenhouse gas (GHG):
- Primary driver of climate change, contributing ~66% of global warming since pre-industrial times.
- Sources:
- Natural: respiration, decomposition, wildfires, ocean releases, volcanic eruptions.
- Anthropogenic: fossil fuel burning, industry, land-use change.
- Natural sinks (forests, oceans) absorb roughly half of human CO2 emissions.
- Other GHGs:
- Methane (CH4): 16% of warming; increased to 1,942 ppb in 2024. Lifetime ~12 years.
- Nitrous oxide (N2O): 6% of warming; increased to 338 ppb in 2024. Lifetime 100–120 years.

Trends and Record Increase
- Long-term trend: CO2 has never declined in last 40 years; annual average increase: 0.8 ppm/year since 1957.
- Acceleration:
- 1960s: 0.8 ppm/year.
- 2011–2020: 2.4 ppm/year.
- 2023–2024: record jump of 3.5 ppm/year, unprecedented.
- Relative to pre-industrial levels (278.3 ppm): Current CO2 152% higher.
Causes Behind Record Rise
- Anthropogenic emissions: Continued fossil fuel burning.
- Natural feedbacks reducing CO2 absorption:
- Oceans: reduced solubility due to higher temperatures.
- Forests and land sinks: extreme droughts, wildfires, deforestation reduced CO2 uptake.
- Exceptional events: Large-scale forest fires in 2024 added extra emissions.
- Feedback loops: Higher temperatures → less CO2 absorption → more warming → more emissions.
Global Temperature Context
- 2024: Warmest year recorded, 1.55°C above pre-industrial levels.
- Significance: Breaching 1.5°C threshold increases risks of:
- Irreversible climate impacts (sea-level rise, ice melt).
- Extreme weather events (heatwaves, floods, droughts).
- GHG contribution:
- CO2: ~75% of warming in last decade.
- CH4: shorter-term impact but potent GHG.
- N2O: long-term atmospheric persistence.
Implications and Challenges
- Rapid CO2 accumulation signals failure to slow emissions meaningfully despite global efforts.
- Climate feedbacks exacerbate warming: higher CO2 → reduced absorption → higher temperatures → more CO2 release.
- Urgency for action: Need enhanced mitigation, renewable energy adoption, forest protection, and global cooperation.
Key Data / Facts
| Parameter | 2024 Value | Trend / Notes |
| CO2 concentration | 423.1 ppm | +2.9 ppm from 2023, +51.4 ppm since 1990 |
| Global temp above pre-industrial | 1.55°C | First annual average >1.5°C |
| Methane (CH4) | 1,942 ppb | +8 ppb from 2023; avg 10.6 ppb/year last decade |
| Nitrous oxide (N2O) | 338 ppb | +1 ppb from 2023; avg 1.07 ppb/year last decade |
| CO2 contribution to warming | ~66% since pre-industrial; ~75% in last decade | Primary driver of climate change |


