Content :
- 12 killed as key bridge collapses in Vadodara
- ASI allows retired T.N. archaeologist to prepare report on Keeladi excavations
- How can cat bonds plan for a natural disaster?
- How did Himachal achieve a high rank on the NAS?
- India’s Inequality Debate
- IAF Jaguar Jet Crash
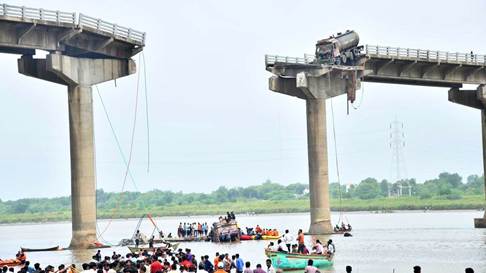
12 killed as key bridge collapses in Vadodara
The Incident
- Date & Location: Early morning, July 10, 2025 — Gambhira river bridge near Padra town, Vadodara district, Gujarat.
- Casualties: At least 12 dead, 9 rescued, 5 hospitalized.
- Collapse Type: A 15-meter-long concrete slab between two piers gave way.
- Vehicles Involved: Trucks, vans, and private vehicles tumbled into Mahisagar river.
Relevance : GS 3(Disaster Management)
Bridge Profile
- Structure Age: ~40 years old, linking Central Gujarat with the Saurashtra region.
- Type: RCC bridge — likely designed with pre-liberalisation specifications, outdated by modern stress norms.
- Function: Major economic and passenger artery; collapse disrupts movement of agricultural and industrial goods.
Probable Causes
- Structural Fatigue: Age-related concrete degradation and poor pier maintenance.
- Monsoon Impact: Heavy rains may have compromised soil or base structures.
- Lack of Audit: No recent comprehensive structural health monitoring reported.
Broader Governance Context
1. Systemic Neglect of Infrastructure Audits
- CAG & Parliamentary Committees have repeatedly flagged:
- Lack of periodic audits for aging bridges.
- Incomplete implementation of Bridge Management Systems (BMS) by States.
2. Absence of Preventive Maintenance Culture
- Focus remains on post-tragedy repair, compensation, and political blame games.
- No public database on load capacity, usage frequency, structural stress for old bridges.
3. Urban-Rural Infrastructure Divide
- Most such collapses occur in semi-urban/rural areas due to:
- Lower prioritisation.
- Infrequent inspection cycles.
- Absence of real-time monitoring sensors.
Comparative Insight: Recent Bridge Collapses
| Location | Year | Cause | Casualties |
| Morbi, Gujarat | 2022 | Corrosion, overloaded footbridge | 135+ dead |
| Bihar (Ganga Bridge) | 2024 | Under-construction, design flaw | 3 dead |
| Mizoram | 2023 | Railway bridge collapse | 26 dead |
| Now: Gambhira, Gujarat | 2025 | Age + structural neglect | 12+ dead |
Pattern: India sees approx.10–15 major bridge failures annually, many preventable through timely inspection.
Policy & Administrative Fallout
- Expected Probes:
- PWD/State Infrastructure Department likely to face inquiry.
- Probable FIRs against bridge maintenance contractors.
- Governance Signals:
- Trust deficit in public infrastructure.
- Pressure on Gujarat government amid upcoming fiscal planning for the 2026 Census preparation phase.
Way Forward: A Governance-Driven Infrastructure Agenda
- Bridge Safety Audit Mandate: Annual certified audits for all bridges 20+ years old.
- Digital BMS Expansion: Geo-tag, track, and monitor bridges via sensors & satellite imaging.
- Independent Safety Authority: Bridge safety oversight body independent of State PWDs.
- Transparent Public Dashboard: Real-time update on bridge health for citizen awareness.
- Preventive Budgeting: Earmark minimum 1% of GSDP annually for infra-retrofitting.
ASI allows retired T.N. archaeologist to prepare report on Keeladi excavations
What is Keeladi and Why It Matters
- Location: Keeladi, Sivaganga district, Tamil Nadu.
- Findings: Urban settlement traces, brick structures, script inscriptions, pottery, and industrial remains.
- Significance: Indicates a Sangam-era urban civilisation (circa 6th century BCE – 3rd century CE), suggesting:
- Continuity of Tamil culture
- Urban centres along the Vaigai river valley
- Advanced trade, literacy, and planned habitation pre-dating many north Indian sites.
Relevance : GS 1(Culture ,Heritage,History )

Timeline of Excavations
| Phase | Year | Lead Agency/Archaeologist | Key Findings |
| I–II | 2015–2016 | K. Amarnath Ramakrishna (ASI) | Brick structures, graffiti suggesting urban life |
| III | 2017 | P.S. Sriraman (ASI) | Controversial – no continuity reported in structures |
| IV+ | 2018 onwards | Tamil Nadu State Archaeology Dept. | Continued urban findings; now in 10th phase by 2025 |
Institutional Conflict
- 2017: ASI transferred Ramakrishna to Assam post-phase II, despite breakthrough findings.
- Sriraman Phase (III): Claimed lack of continuity with prior phases → criticized for downplaying significance.
- 2024–25: ASI permitted Sriraman to complete pending reports for Phase III (Keeladi) and Kodumanal.
- Meanwhile: ASI asked Ramakrishna to revise his original reports — he refused, defending his conclusions as sound and peer-worthy.
Keeladi vs Kodumanal
- Kodumanal: Located in Erode district — known for bead-making industry, iron tools, and trade links with the Roman Empire.
- Sriraman also excavated one season here; report pending.
Current Progress
- 10 Phases completed at Keeladi (State-led).
- Hundreds of antiquities recovered.
- Material stored in Chennai, facilitating ongoing study and report writing.
Governance Challenges
- Conflict of Interpretations: Differences in archaeological conclusions reflecting possible ideological or bureaucratic interference.
- Central vs State Dynamics: Shift of excavation control from ASI to Tamil Nadu State Archaeology Dept. led to more sustained exploration.
- Report Delays: Highlights need for a time-bound reporting framework in Indian archaeology.
Implications for Indian Cultural History
- Counters Aryan-centric narratives: Keeladi suggests Dravidian urbanism existed independently and early.
- Sangam Age Reimagined: Reinforces historicity of Sangam literature describing trade, urban governance, literacy, and culture.
- Decentralised Heritage Management: Tamil Nadu’s persistence led to deeper exploration, setting an example for other States.
How can cat bonds plan for a natural disaster?
What are Cat Bonds?
- Definition: A hybrid insurance-cum-debt financial instrument that transforms disaster insurance into tradable securities.
- Purpose: Transfers pre-defined natural disaster risk (e.g., earthquakes, cyclones) from sovereigns to global investors.
- Issued via: Financial intermediaries like the World Bank, Asian Development Bank, or reinsurers.
- Payout Trigger: Based on objective disaster parameters (magnitude, location) — parametric triggers.
Relevance : GS 3(Economy, Disaster Management, and Environment )
How Do Cat Bonds Work?
| Component | Role |
| Sponsor | Sovereign/state (e.g., India) – pays premium and defines risk scope |
| Issuer | Intermediary agency (e.g., World Bank) – issues bonds to investors |
| Investor | Pension funds, hedge funds, family offices – provide upfront funds |
| Trigger Event | If disaster strikes, part/all of investor principal is used for relief |
High returns, high risk: If no disaster occurs, investors earn attractive interest. If disaster hits, they lose some/all principal.
Why Investors Buy Cat Bonds
- Portfolio Diversification: Cat risk curves are independent of market risk (low correlation).
- High Returns: Coupon rates vary (1–2% for earthquakes; higher for hurricanes/cyclones).
- $180 Billion+ issued globally so far; $50 Billion currently outstanding.
- Favored by: Large pension funds, seeking low-correlation assets for risk hedging.
Why India Should Lead in Cat Bonds
- Disaster-Prone Profile:
- India faces recurring floods, cyclones, earthquakes, and forest fires.
- Example: ₹1.8 lakh crore spent on disaster relief over the past decade (approx).
- Under-penetration of insurance:
- Individual homes, livelihoods mostly uninsured → leads to financial vulnerability post-disaster.
Fiscal Prudence:
- Annual Mitigation Budget: ₹1.8 billion allocated since FY21–22 for capacity building.
- Cat Bonds reduce strain on public finances post-disaster → predictable budgeting.
A South Asian Regional Cat Bond – The Big Idea
- India as Lead Sponsor: Leverage its credit rating, financial depth, and disaster mitigation record.
- Risk Pooling Benefits:
- Shared risk lowers individual premiums.
- Leverages region’s hazard diversity (earthquakes in Nepal/Bhutan, tsunamis in Bay of Bengal, cyclones in Bangladesh & India).
- Geo-economic Gain: Enhances India’s role as a disaster-resilient regional leader in South Asia.
Design Flaws: Challenges to Watch
- Trigger Mismatch Risk:
- Example: Earthquake bond designed for 6.6M threshold may not pay out for 6.5M quake that causes major damage.
- Perception Risk:
- If no disaster occurs, questions may arise on high upfront costs.
- Solution: Transparent cost-benefit comparisons with historical relief expenditure.
Policy Recommendations
- Pilot a Cat Bond: Start with one high-impact hazard (e.g., floods in Assam or coastal cyclones).
- Use World Bank/ADB as Issuer: Tap into established credibility and global investor networks.
- Layer with Mitigation: Include DRR commitments (e.g., early warning systems) to lower premiums.
- Build Awareness: Educate policymakers and state disaster management authorities (SDMAs) on financial risk transfer tools.
How did Himachal achieve a high rank on the NAS?
What is the NAS?
- Conducted by: Ministry of Education (every 3 years)
- Coverage: Classes 3, 5, 8, and 10 in govt & aided schools.
- Subjects Tested: Language, Mathematics, Environmental Science, Science, Social Science.
- Purpose: Diagnostic tool to assess learning outcomes across States.
Relevance : GS 2(Education , Governance)
Why Himachal’s Jump is Significant
- 2021 Rank: 21st
- 2025 Rank: Top 5
- Improvement: Massive 16-rank leap in 4 years — biggest positive swing among all States.
- Context: Reversal of a two-decade decline in public schooling quality post-liberalisation.
Reform Strategies Behind the Success
- Structural Rationalisation:
- Over 1,000 under-enrolled schools merged to optimise teacher deployment and infrastructure.
- Unified school system under a single education directorate (pre-primary to Class 12).
- Accountability & Ownership:
- Class 12 focus reintroduced to boost end-stage learning outcomes.
- Greater autonomy in school-level decision-making.
- Teachers and high-performing students sent for exposure visits (national & international).
- Cluster-based School Management:
- Promoted peer learning, resource sharing, and community participation.
- Fostered local identity and emotional connection with schools.
- Political Will:
- Administration showed strong public commitment to education reform, reversing a legacy of neglect.
What NAS Captures — and Misses
| Captures | Misses |
| Language, Maths, Science | Socio-emotional well-being, civic awareness |
| Relative academic benchmarks | Holistic quality of teacher-student relationships |
| State-level learning gaps | Equity dimensions (e.g. rural, marginalised learners’ challenges) |
Test scores ≠ Education quality. Himachal’s real achievement lies in restoring public trust in government schooling, not just academic scores.
Broader Socio-educational Context
- Historical Strengths: Legacy of Y.S. Parmar’s village-centric education model post-Independence.
- Decline Phase: Contractual hiring, poor facilities → private school boom even in remote areas.
- Demographic Challenge: Declining fertility rate (NFHS-5) demanded resource consolidation, not expansion.
Way Forward
- Regularise teacher recruitment to ensure stability and motivation.
- Expand beyond NAS: Introduce holistic assessments focusing on creativity, emotional intelligence, critical thinking.
- Equity Focus: Ensure remote, rural, and SC/ST students are not left behind in resource allocation or digital access.
- Sustain Community Engagement: Strengthen parent-teacher forums and local governance in school management.
India’s Inequality Debate: 10 Critical Analytical Insights
Inequality and the Gini Debate
- In July 2025, the Government of India cited a World Bank brief ranking India as the 4th most equal country globally, based on the consumption-based Gini index (Gini: 0.29).
- However, this ranking masks the ground reality, as income and wealth inequalities in India are among the highest globally, as per the World Inequality Database.
- As of 2023:
- Top 1% earned 22.6% of national income and held 40.1% of total wealth.
- Bottom 50% earned 14.6% of income and held only 6.4% of wealth.
- The Gini index based on consumption does not capture asset inequality, capital income, or structural disadvantages — leading to misleading claims of equality.
- This raises critical questions about the validity of India’s equality claims, the limitations of survey-based data, and the need for multidimensional inequality metrics.
Relevance : GS 3(Indian Economy ,Inequality , Gini Co-efficient)
Claim vs Reality: Gini Index Interpretation
- World Bank’s Brief (2024) ranked India as the 4th most equal country based on consumption-based Gini index.
- India’s Gini index (consumption) was estimated at 0.29, implying low inequality.
- Issue: This metric ignores income and wealth inequality, which are significantly higher.
Income Inequality is Rising Sharply
- As of 2023:
- Top 1% income share: 22.6%
- Top 10% income share: 57.7%
- Bottom 50% share: just 14.6%
- Reflects a threefold gap between top 1% and bottom 50% in income control.
- Source: World Inequality Database
Wealth Inequality is Even More Stark
- In 2023:
- Top 1% own 40.1% of total personal wealth.
- Top 10%: 65%
- Bottom 50%: only 6.4%
- Indicates extreme concentration of wealth.
- Historical trend: Wealth inequality has been consistently rising since the 1990s.
Limitations of Consumption-Based Gini
- It underestimates inequality because:
- Consumption is smoother across households (poor borrow; rich save).
- Surveys underreport elite consumption.
- Rural-urban price differences and housing costs are not well-adjusted.
- Gini fails to capture wealth hoarding, capital gains, inheritance effects.
Survey Quality Issues Distort Findings
- NSSO and NSO surveys suffer from:
- Non-response bias
- Under-sampling of top-income households
- Outdated consumption baskets
- This results in misleading aggregate equality metrics.
India’s Claim Omits Income/Wealth Data
- World Bank brief did not include income or wealth Gini (India does not officially publish them).
- Other global rankings using income or wealth inequality place India far lower in equality metrics.
Taxation System Does Not Correct Inequality
- Pre- and post-tax income share of top 10% shows little difference.
- Indicates that India’s taxation is not redistributive enough.
- Direct taxes and wealth taxes are limited; subsidies don’t offset wealth concentration.
Bigger Picture Missed: Structural Inequality
- Gini does not account for:Caste-based or gender inequalityEducational or health access gapsIntergenerational mobility blockages
- These structural issues exacerbate long-term inequality, especially among marginalised communities.
Global Comparisons are Misleading
- Nordic countries (e.g., Denmark) rank equal on both consumption and income metrics.
- India’s claim of equality collapses when judged on income, asset ownership, or human capital indicators.
- Suggests cherry-picking one metric to portray a broad narrative.
Policy Implications
- Need for triangulation: Combine consumption, income, and wealth data to assess inequality holistically.
- Revise tax structures to be more progressive.
- Improve data transparency: India must release periodic income and wealth Gini estimates.
- Strengthen social safety nets, asset redistribution schemes, and education/health access to reduce long-term disparities.
IAF Jaguar Jet Crash
The Crash: Key Facts
- Incident: A Jaguar fighter aircraft of the Indian Air Force crashed near Churu, Rajasthan on July 9, 2025, during a routine training sortie.
- Fatalities: Both pilots — Wing Commander R. Takle and Flight Lieutenant A. Dixit — lost their lives.
- Pattern: This is the third Jaguar crash since March 2025, highlighting a disturbing frequency.
Relevance : GS 3(Disaster Management , Defence)
Technical & Operational Concerns
- Aging Fleet: Jaguars were inducted into IAF in 1979; many are now over 40 years old.
- Previous Incidents:
- March 2024: Jaguar crash post-takeoff from Ambala, pilot ejected safely.
- March 2025: Pilot died during a similar crash in Rajasthan.
- Combat Capabilities: Designed for deep penetration strikes and low-altitude flying — operationally challenging roles that stress older airframes.
Why It Matters
- Obsolescence Risk: The Jaguar fleet is no longer being upgraded; IAF has discontinued the DARIN-III upgrade midway.
- Crash Trend: Out of 160 Jaguars inducted, fewer than 100 remain. Of these, many are at end-of-life.
- Survivability Issues: Unlike Su-30MKIs and Rafales, Jaguars lack modern ejection systems and sensors, reducing pilot survival chances.
Replacement & Modernization Imperatives
- Future Roadmap:
- Jaguars to be replaced by HAL Tejas Mk1A, Su-30MKI upgrades, and Rafales under ongoing modernization.
- HAL’s Advanced Medium Combat Aircraft (AMCA) is a long-term solution — first flight expected by 2030.
- Gap Risks: Decommissioning Jaguars without rapid replenishment could create operational gaps in deep-strike capabilities.
Macro Picture: India’s Combat Aircraft Fleet
| Aircraft Type | Induction Year | Status | Quantity (approx) |
| Jaguar | 1979 | Phasing Out | ~90 |
| Mirage 2000 | 1985 | Mid-Life Upgrade | ~50 |
| Su-30MKI | 2002 onwards | Backbone Fleet | 270 |
| Rafale | 2020 onwards | Operational | 36 |
| Tejas Mk1A | 2024 onwards | Inducting | 83 ordered |
Strategic Implications
- Training & Safety Protocols: Routine sorties turning fatal signal need for enhanced flight safety audits and stress testing of aging jets.
- Global Perception: Frequent crashes may dent IAF’s image in international military aviation, especially in light of export ambitions (e.g., Tejas).
- Pilot Morale & Safety: High-risk training in outdated platforms could impact combat readiness and morale of younger IAF personnel.


