Context
- Made in India Label Scheme
- Logistics: India’s growth engine
Made in India Label Scheme
Context and Background
- COVID-19 impact (2020): Supply chain disruptions pushed India towards self-reliance → Atmanirbhar Bharat Abhiyan.
- Make in India (2014): Focused on investment, innovation, infrastructure, and manufacturing hub creation.
- Vocal for Local (2020 onwards): Strengthened consumer and government focus on promoting Indian products.
- Made in India Label (2025): A branding + certification initiative to unify India’s manufacturing identity under a global-quality benchmark.
Relevance : GS 3(Indian Economy)
Core Features of the Scheme
- Voluntary certification for manufacturers/producers.
- QR-coded labels + logo → Provides:
- Origin of product.
- Place of manufacturing.
- Validity of certification.
- Product-specific details.
- Administered by DPIIT with advisory role of:
- Quality Council of India (QCI).
- India Brand Equity Foundation (IBEF).
- Funding: ₹995 crores for first 3 years; expected to be self-sustaining later.
Objectives
- Provide authentic identity to Indian-origin products.
- Differentiate Indian products in global markets.
- Boost consumer confidence through traceability and quality assurance.
- Strengthen domestic industries and export competitiveness.
- Build a global brand India image similar to Made in Germany or Made in Japan.
Eligibility and Certification Process
- Eligibility:
- Products wholly or substantially manufactured/assembled in India.
- Compliance with industry-specific quality & regulatory standards.
- Process:
- Online application on official portal.
- Submission of documents + product details.
- Verification and approval.
- Certification granted with permission to use label.
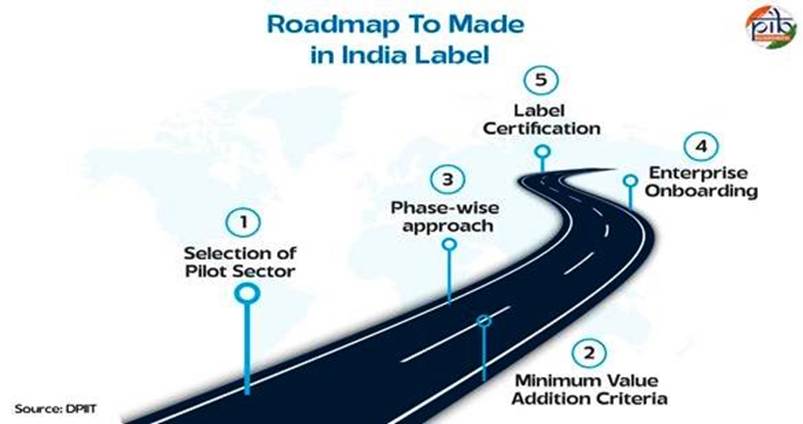
Key Provisions
- Minimum Value Addition: 50% (industry-wise exceptions possible).
- Pilot Sectors: Identified based on standards, local trade value addition, and consultations.
- Phase-wise Expansion: Gradual inclusion of more industries/products.
- Enterprise Onboarding: On MII portal with simplified experience.
- Quality Audits: Random Quality Conformity Assessments for credibility.
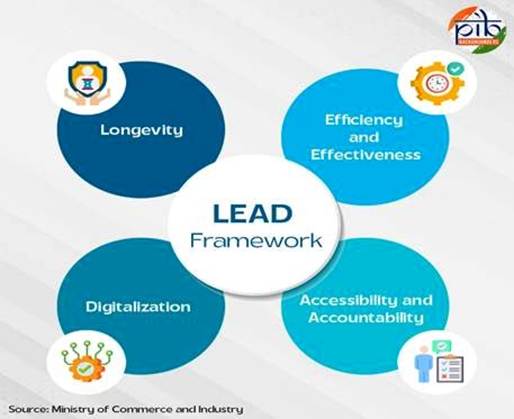
Integration with National Development Vision
- Linked to SMART Nation vision:
- Sustainability
- Manufacturing Capability
- Atmanirbharta
- Rating (global competitiveness)
- Technology
- Global Quality Infrastructure Index 2023: India ranked 10th → Indicates strong metrology, standardisation, and accreditation backbone.
Sectoral Case Studies
- Steel (2023): Two integrated steel producers adopted Made in India branding → improved global positioning, credibility, and customer trust.
- Textiles (2024): QCI–KVIC MoU for integrating branding and quality standards in MSMEs → globalising Khadi and village industries.
- Electronics (2024): Legal Metrology (Packaged Commodities) Rules amended → QR-based declarations on electronic goods → supports transparency and consumer trust.
Roadmap for Success
- Pilot sector → framework definitions & pain points addressed.
- Phase-wise rollout across industries.
- Legal, technical, and marketing infrastructure developed.
- Financial outlay of ₹995 crore covers:
- Programme team.
- Technology costs.
- Marketing & IEC campaigns.
- Legal consultation.
- Redressal mechanisms.
- Future aim: Self-sustaining ecosystem for branding Indian products globally.
Strategic Importance
- Economic:
- Supports MSMEs and large-scale manufacturers.
- Enhances export competitiveness.
- Reduces import dependence by encouraging domestic consumption.
- Consumer:
- Builds trust and pride in Indian products.
- Provides transparency and authenticity checks.
- Diplomatic/Global:
- Enhances India’s credibility as a manufacturing hub.
- Competes with established country-of-origin labels (Made in Italy, Made in Japan).
- Social:
- Strengthens employment in domestic sectors (agriculture, fisheries, textiles, electronics, steel).
- Aligns with Atmanirbhar Bharat for socio-economic independence.
Challenges Ahead
- Ensuring uniform adoption across diverse industries.
- Preventing misuse or counterfeit labels.
- Balancing stringent quality benchmarks with MSME ease of compliance.
- Creating international acceptance of the label amidst global competition.
- Avoiding overlap with existing certification schemes (ISI, Hallmark, BIS standards).
Conclusion
- The Made in India Label Scheme is both an economic strategy and a soft power tool.
- It integrates Atmanirbhar Bharat (self-reliance) with Make in India (manufacturing hub vision).
- Provides India with a national brand identity in manufacturing, much like successful global peers.
- Success will depend on quality enforcement, consumer trust, MSME inclusion, and international recognition.
Logistics: India’s growth engine
Understanding Logistics
- Definition: Logistics refers to the management of the flow of goods, services, and information from the point of origin to the point of consumption.
- Components: Transportation, warehousing, inventory management, packaging, distribution, last-mile delivery, and digital tracking.
- Role in Economy:
- Connects producers → consumers (domestic & global).
- Reduces costs, improves efficiency, and ensures timely delivery.
- Backbone of trade, industry, e-commerce, agriculture, and services.
Relevance : GS 3(Infrastructure)
India’s Logistics Landscape
- Contribution: Employs 22+ million people; crucial for job creation.
- Valuation: USD 215 billion in 2021, growing at 10.7% CAGR till 2026.
- Infrastructure Status: Granted in 2017 → enables cheaper, long-term funding like roads/railways.
- GDP Link: Logistics costs in India are ~13–14% of GDP (vs 8–10% in developed countries). Reducing to <10% by 2030 is a policy goal.
- Recent Growth Drivers: Post-COVID recovery, GST, e-commerce boom, and government reforms.
Key Government Initiatives
(a) Policy & Planning
- National Logistics Policy (2022):
- Aim: Seamless logistics ecosystem, reduce costs, improve global competitiveness.
- Tools: Unified Logistics Interface Platform (ULIP), Logistics Data Bank (LDB).
- PM GatiShakti National Master Plan (2021):
- Integrated multi-modal infrastructure (rail, road, ports, airways, digital).
- 57 central ministries + all states on a 1,700 data-layer platform.
- LEADS Report (annual): Tracks state-level logistics performance → guides policy.
(b) Infrastructure Projects
- Dedicated Freight Corridors (DFCs):
- EDFC (Ludhiana–Sonnagar, 1337 km) + WDFC (JNPT–Dadri, 1506 km).
- 96.4% operational by March 2025.
- Benefits: Reduced congestion, lower costs, energy-efficient freight.
- Multi-Modal Logistics Parks (MMLPs):
- 35 locations approved (e.g., Chennai, Bengaluru, Nagpur, Indore).
- 5 to be operational by 2027.
- Integrates warehousing, storage, and transport hubs.
- Maritime Amrit Kaal Vision 2047:
- Long-term roadmap for ports, green shipping, hydrogen hubs, coastal tourism, shipbuilding.
- ₹10 lakh crore investments committed at GMIS 2023.
- Inland Waterways:
- Record 145.5 MT cargo in 2024–25.
- Operational waterways increased from 24 → 29.
(c) Digital Reforms
- ULIP: Digital platform integrating multiple logistics-related databases.
- Crossed 100 crore API transactions (2025).
- Enables real-time tracking, shipment ETAs, and inventory planning.
- LDB: Tracks EXIM cargo (75 million containers traced by Oct 2024).
- E-Way Bill (2018 onwards): Digital permit for goods >₹50,000. Eliminates paperwork, increases compliance, reduces delays.
- GST (2017): Removed interstate check-posts → improved transit time by 33%, cut costs, improved logistics efficiency.
(d) Skill Development
- Gati Shakti Vishwavidyalaya (GSV):
- First university dedicated to logistics & transport education.
- Partnerships with 40+ industries/institutions.
- Goal: Train skilled manpower for India’s growing logistics needs.
Sustainability in Logistics
- Freight GHG Calculator: Tracks emissions for different modes.
- Rail Green Points: Helps customers measure carbon savings using rail vs road.
- Goal: Increase rail freight share from 35–36% → 45% by 2030.
- Digital platforms (ULIP, LDB): Help businesses choose greener transport modes.
- Coal Logistics Plan: Pushes shift to rail-based movement.
India’s Global Position
- World Bank’s Logistics Performance Index (LPI) 2023:
- India ranked 38th/139 (up 6 places from 2018).
- Goal: Enter top 25 by 2030.
- Comparison:
- India: 13–14% logistics cost of GDP.
- China: ~8–9%.
- Germany/Japan: ~7–8% with highly efficient multimodal networks.
Employment & Economic Impact
- Employment: 22 million currently; expected to generate millions more jobs via infrastructure projects, MMLPs, and DFCs.
- Exports: Reduced costs → more competitive global trade.
- Domestic Impact: Improves availability of goods, reduces consumer prices, strengthens MSMEs and agriculture value chains.
Challenges
- High logistics costs (13–14% of GDP).
- Infrastructure gaps in Tier-2/Tier-3 cities.
- Over-reliance on road transport (~60%) → congestion + emissions.
- Complex regulatory environment across states despite GST.
- Skill gaps in logistics workforce.
- Need for stronger digital adoption in smaller enterprises.
Way Forward
- Expand multimodal integration (rail, water, air).
- Strengthen inland waterways (low cost + eco-friendly).
- Invest in green logistics (EV trucks, hydrogen hubs, rail freight).
- Encourage private investment in MMLPs, warehouses, cold chains.
- Improve last-mile connectivity in rural & semi-urban regions.
- Promote skill development via GSV and logistics skilling programs.
- Focus on reducing costs to <10% of GDP by 2030.
Conclusion
- Logistics is India’s backbone for trade, industry, and economic growth.
- It transforms “movement of goods” into “movement of opportunities.”
- With NLP, GatiShakti, DFCs, MMLPs, and digitalization, India is on track to become a top 25 logistics performer by 2030.
- A strong logistics ecosystem is key for achieving $5 trillion economy (2027) and Viksit Bharat 2047 vision.


