Content
- The Solar Surge: India’s Bold Leap Toward a Net Zero Future
- Minimum Support Prices (MSPs) for all crops
The Solar Surge: India’s Bold Leap Toward a Net Zero Future
Basic Context & Global Position
- Current Global Rankings (2025):
- 3rd largest solar power producer globally (overtook Japan)
- 4th in renewable energy installed capacity worldwide
- 4th in wind power capacity
- 3rd in solar power capacity
- Key Production Milestone:
- India: 108,494 GWh solar energy generated
- Japan: 96,459 GWh (now behind India)
Solar Capacity Breakdown (July 2025)
- Total Solar Capacity: 119.02 GW
- Ground-mounted solar: 90.99 GW (76%)
- Grid-connected rooftop: 19.88 GW (17%)
- Hybrid projects: 3.06 GW (3%)
- Off-grid installations: 5.09 GW (4%)
- Growth Rate: 4,000% increase in solar capacity over recent years
- Total Solar Potential: 748 GW across India
Relevance : GS 3(Energy Security , Environment and Ecology)
Geographic Distribution & High-Potential States
- Northern & Western Region:
- Rajasthan, Gujarat (highest potential)
- Southern & Central Region:
- Karnataka, Tamil Nadu, Andhra Pradesh
- Eastern & Other Regions:
- Maharashtra, Chhattisgarh, Odisha
- Notable Achievement: Palli village (J&K) became India’s first carbon-neutral panchayat
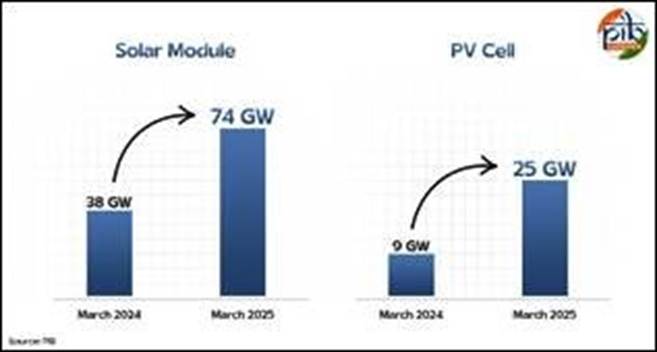
Manufacturing Capacity Revolution
- Solar Module Manufacturing:
- March 2024: 38 GW capacity
- March 2025: 74 GW capacity (95% increase in one year)
- Solar PV Cell Manufacturing:
- March 2024: 9 GW capacity
- March 2025: 25 GW capacity (178% increase)
- New Milestone: First ingot-wafer manufacturing facility (2 GW) operational
- Historical Growth (2014-2025):
- PV cells: 1.2 GW → 25 GW (21x increase)
- PV modules: 2.3 GW → 78 GW (34x increase)
Government Policy Support
- Import Protection:
- Basic Customs Duty (BCD) on imported solar cells/modules (April 2022)
- Mandatory use of Indian-made products in government schemes
- Key Schemes Requiring Domestic Components:
- Rooftop Solar Programme
- PM-KUSUM
- CPSU Scheme Phase II
Major Government Initiatives
PM Surya Ghar: Muft Bijli Yojana
- Budget: ₹75,021 crores
- Target: 1 crore households
- Benefit: Up to 300 units free electricity monthly
- Subsidies:
- 1 kW: ₹30,000
- 2 kW: ₹60,000
- 3 kW+: ₹78,000
- Savings: ₹15,000 annually even after loan EMI
PM-KUSUM Scheme
- Focus: Farmer solar adoption
- Subsidies: 30-50% for solar pumps
- Capacity: Up to 2 MW solar plants per farmer
- Revenue: Farmers can sell electricity to DISCOMs
Solar Parks Scheme
- Target: 40 GW by March 2026
- Approved: 53 parks (39,323 MW capacity) across 13 states
- Operational: 13,896 MW across 26 parks
- Status: 18 parks fully developed (10,856 MW)
PM JANMAN Initiative
- Budget: ₹515 crores
- Target: 1 lakh un-electrified tribal households
- Coverage: 18 states, focusing on PVTGs
Innovative Solar Technologies
- Floating Solar:
- Omkareshwar Floating Solar Park (Madhya Pradesh)
- Capacity: 600 MW planned
- Cost: ₹330 crores
- Benefits: Land conservation, higher efficiency
- Agrivoltaics:
- Dual land use: solar + farming
- Examples: Sun master Plant (Delhi), 105 KW ICAR system (Jodhpur)
- Benefits: Increased farmer income, efficient land use
Global Leadership Initiatives
International Solar Alliance (ISA)
- Founded: 2015 by India and France at COP21
- Members: 100+ countries
- Investment Target: $1 trillion by 2030
- Focus: LDCs and Small Island Developing States
One Sun One World One Grid (OSOWOG)
- Launched: 2018 at ISA Assembly
- Vision: Global solar grid connectivity
- Coverage: South Asia to Africa and Europe
- Concept: “The sun never sets” – continuous solar supply
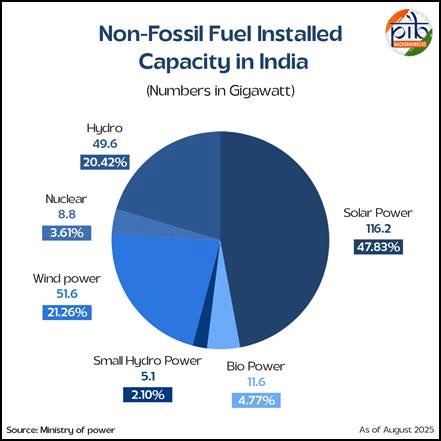
Overall Renewable Energy Context
- Total Power Capacity: 484.82 GW
- Renewable Share: 50.07% (achieved COP26 target 5 years early)
- Non-fossil Fuel Capacity: 242.8 GW (June 2025)
- Breakdown:
- Renewable energy: 233.99 GW
- Nuclear: 8.8 GW
- Energy Mix:
- Thermal: 242 GW
- Solar: 116 GW
- Wind: 51.6 GW
Growth Trajectory & Achievements
- 2024-25 Record: 29.52 GW renewable capacity added
- 11-Year Growth: RE capacity grew 3x (76.37 GW in 2014 → 233.99 GW in 2025)
- 2030 Target: 500 GW non-fossil fuel capacity
Supporting Renewable Technologies
Wind Energy
- Capacity: 51.6 GW (4.15 GW added in FY 2024-25)
- Global Rank: 4th in onshore wind
- Potential: 1,164 GW
- Contribution: 4.56% of total electricity generation
Bioenergy
- Capacity: 11.60 GW (including waste-to-energy)
- Budget: ₹1,715 crores (National Bioenergy Programme 2021-2026)
- Components: Waste-to-energy, biomass, biogas, biofuel blending
Ethanol Blending
- Current Status: 17.98% blending (February 2025)
- Target: 20% by 2025-26 (ahead of 2030 original target)
- Global Position: 3rd largest ethanol producer and consumer
Green Hydrogen
- Mission Target: 5 million tonnes annually by 2030
- Investment: ₹8 lakh crore expected
- Job Creation: 6 lakh jobs
- Import Savings: ₹1 lakh crore in fossil fuel imports
- Hub Ports: Kandla, Paradip, Tuticorin
Recent Policy Developments (2025)
- July 2025: ₹7,000 crore exemption for NLC India Ltd
- NLC Expansion Plan:
- Current: 2 GW
- 2030 target: 10 GW
- 2047 target: 32 GW
Five Key Strategic Priorities for 2030
- Better Contracts: Long-term power purchase agreements
- Stronger Grids: Modern infrastructure with battery storage
- Make in India: Boost local manufacturing
- Smart Land Use: Floating solar, agrivoltaics
- Easy Financing: Accessible funding mechanisms
International Commitments & Progress
Paris Agreement NDCs
- Carbon Intensity: 45% reduction by 2030 (vs 2005 levels)
- Non-fossil Capacity: 50% by 2030 (achieved 5 years early)
- Net Zero Target: 2070
COP26 Commitments (Panchamrit)
- 500 GW non-fossil capacity by 2030
- Currently on track with accelerated progress
Strategic Impact & Benefits
- Energy Security: Reduced dependence on coal imports
- Economic Benefits: Job creation across renewable value chain
- Rural Development: Farmer income enhancement through solar initiatives
- Manufacturing: Domestic production reducing import dependency
- Innovation: Leadership in floating solar, agrivoltaics, green hydrogen
Challenges & Future Outlook
Infrastructure Requirements
- Grid modernization for renewable integration
- Energy storage solutions for intermittency
- Transmission infrastructure development
Policy Success Factors
- Import duties protecting domestic manufacturing
- Subsidy schemes driving adoption
- Mandatory domestic content requirements
- Long-term policy consistency
Conclusion: Key Success Indicators
- Speed of Achievement: Major targets met ahead of schedule
- Comprehensive Approach: Technology + policy + manufacturing + international cooperation
- Social Impact: Rural electrification, farmer empowerment, tribal community inclusion
- Economic Transformation: From energy importer to potential exporter
- Global Leadership: ISA, OSOWOG initiatives positioning India as renewable energy leader
MINIMUM SUPPORT PRICES (MSPS)FOR ALL CROPS
What is MSP?
- Definition: Government-guaranteed minimum price for agricultural crops to protect farmers from price volatility
- Coverage: 22 mandated agricultural crops across India
- Authority: Commission for Agricultural Costs & Prices (CACP) recommends MSP rates
- Frequency: Fixed annually by the Government of India
- Implementation: Digital payment system for MSP procurement
Relevance : GS 2(Governance) , GS 3(Agriculture)
Decision-Making Process
- Primary Recommender: Commission for Agricultural Costs & Prices (CACP)
- Consultation Process: Views from State Governments and Central Ministries/Departments
- Final Authority: Central Government fixes final MSP rates
- Scope: Applied uniformly across the country
MSP Performance Data (2024-25: July to June)
Quantitative Achievements
- Total Procurement: 1,175 lakh metric tonnes (117.5 million metric tonnes)
- MSP Amount Paid: ₹3.33 lakh crores (₹33,300 billion)
- Farmers Benefitted: 1.84 crores (18.4 million farmers)
Key Metrics Analysis
- Average MSP per farmer: ₹18,098 per farmer (₹3.33 lakh crores ÷ 1.84 crore farmers)
- Average procurement per farmer: 6.38 metric tonnes per farmer
- Average price per metric tonne: ₹28,340 across all crops
Current Policy Status
Loan Waiver Status
- No active loan waiver scheme currently operational in Department of Agriculture & Farmers Welfare
- Alternative approach: Structured financial support through multiple targeted schemes
Digital Infrastructure
- Payment System: Digital payment implementation for MSP procurement
- Transparency: Enhanced through digital systems
- Efficiency: Reduced transaction costs and time
Supporting Agricultural Schemes
Pradhan Mantri Kisan Samman Nidhi (PM-KISAN)
Basic Structure
- Launch Date: February 2019
- Scheme Type: Central Sector Scheme
- Annual Benefit: ₹6,000 per eligible farmer
- Payment Structure: Three equal installments of ₹2,000 each
- Target Group: Land-holding farmers
Financial Performance
- Total Disbursement: Over ₹3.69 lakh crores since inception
- Installments Completed: 19 installments (as of August 2025)
- Payment Method: Direct Benefit Transfer (DBT) to Aadhaar-seeded bank accounts
- Transparency Features: Complete digital verification and registration process
Impact Analysis
- Average annual disbursement: ≈₹56,000 crores per year (₹3.69 lakh crores ÷ 6.5 years)
- Estimated beneficiaries: ≈9.3 crore farmers (based on ₹6,000 per farmer annually)
Pradhan Mantri Fasal Bima Yojana (PMFBY)
Scheme Overview
- Launch: Kharif 2016 season
- Purpose: Crop insurance against natural calamities and adverse weather
- Objective: Income stabilization for farmers
Financial Performance (2016-2025)
- Farmers’ Premium Paid: ₹35,753 crores
- Claims Paid to Farmers: ₹1.83 lakh crores (as of June 30, 2025)
- Benefit Ratio: 5:1 (claims received vs. premium paid)
- Net Benefit to Farmers: ₹1.47 lakh crores (₹1.83 lakh – ₹0.36 lakh crores)
Coverage and Impact
- Risk Coverage: Natural calamities, adverse weather, pest attacks
- Financial Protection: Comprehensive crop loss compensation
- Affordability: Low premium burden for farmers due to government subsidies
Modified Interest Subvention Scheme (MISS)
Scheme Structure
- Funding: 100% centrally funded
- Coverage: All States and Union Territories
- Target: Short-term agricultural loans through Kisan Credit Cards (KCC)
- Benefit: Concessional interest rates for working capital requirements
Five-Year Financial Performance (2020-25)
| Year | Disbursement (₹ Crores) | Year-on-Year Change |
| 2020-21 | 17,789.72 | – |
| 2021-22 | 21,476.93 | 20.7% |
| 2022-23 | 17,997.88 | -16.2% |
| 2023-24 | 14,251.92 | -20.8% |
| 2024-25 | 17,811.72 | 25.0% |
Analysis of Trends
- Total Disbursement (5 years): ₹89,328.17 crores
- Average Annual Disbursement: ₹17,866 crores
- Peak Year: 2021-22 (₹21,477 crores)
- Recent Recovery: 25% increase in 2024-25 after two years of decline
Agriculture Infrastructure Fund (AIF)
Scheme Background
- Launch Year: 2020
- Initiative: Part of Atmanirbhar Bharat package
- Scheme Type: Central Sector Scheme
- Primary Focus: Post-harvest management and community farming assets
Financial Framework
- Total Fund Size: ₹1 lakh crore loan facility
- Interest Rate Cap: Maximum 9% on loans
- Loan Type: Medium to long-term debt financing
- Lending Mechanism: Through established financial institutions
Performance as of June 30, 2025
- Sanctioned Amount: ₹66,310 crores (66% of target achieved)
- Projects Sanctioned: 1,13,419 projects
- Total Investment Mobilized: ₹1,07,502 crores
- Leverage Ratio: 1.6:1 (total investment vs. sanctioned amount)
Project Category Breakdown
- Custom Hiring Centres: 30,202 projects (26.6%)
- Processing Units: 22,827 projects (20.1%)
- Warehouses: 15,982 projects (14.1%)
- Sorting & Grading Units: 3,703 projects (3.3%)
- Cold Storage Projects: 2,454 projects (2.2%)
- Other Post-harvest Projects: 38,251 projects (33.7%)
State-wise Allocation
- Allocation Basis: Ratio of total value of output of Agriculture and Allied sectors
- Coverage: All States and Union Territories
- Decentralized Implementation: State-specific project approval and monitoring
Integrated Analysis of Agricultural Support System
Financial Scale and Impact
- Combined Annual Support: Approximately ₹60,000+ crores across all schemes
- Direct Beneficiaries: 10+ crore farmers across different schemes
- Infrastructure Development: 1+ lakh projects under AIF alone
- Risk Mitigation: Comprehensive crop insurance with 5:1 benefit ratio
Policy Approach: No Loan Waiver Strategy
Why No Loan Waiver?
- Structured Support Preferred: Multiple targeted schemes instead of blanket waivers
- Sustainability Concerns: Loan waivers can create moral hazard and fiscal burden
- Comprehensive Coverage: MSP, income support, insurance, infrastructure development
Alternative Support Mechanisms
- Income Support: PM-KISAN provides direct cash transfers
- Price Protection: MSP ensures minimum guaranteed prices
- Risk Coverage: PMFBY provides comprehensive crop insurance
- Credit Support: MISS reduces borrowing costs
- Infrastructure: AIF develops post-harvest facilities
Technology Integration
- Digital Payments: MSP procurement through digital systems
- Aadhaar Integration: PM-KISAN uses Aadhaar-seeded accounts
- DBT Implementation: Direct Benefit Transfer reduces leakages
- Transparency: Digital systems ensure accountability
MSP System Challenges
- Limited Crop Coverage: Only 22 crops out of hundreds grown
- Geographic Concentration: MSP procurement mainly in certain states
- Storage and Logistics: Infrastructure constraints in procurement
- Price Discovery: Market prices often below MSP for many crops
Scheme-specific Challenges
PM-KISAN
- Landholding Requirement: Only land-owning farmers eligible
- Small Amount: ₹6,000 annually may be insufficient for meaningful impact
- Documentation: Requires proper land records
PMFBY
- Claim Settlement: Delays in claim processing
- Coverage Gaps: Some risks not covered
- Premium Burden: Even subsidized premium can be high for marginal farmers
MISS
- KCC Penetration: Not all farmers have Kisan Credit Cards
- Documentation Requirements: Formal credit procedures
- State Variations: Implementation quality varies across states
AIF
- Loan-based: Requires repayment capacity
- Technical Expertise: Need for project preparation and management
- Collateral Requirements: May limit access for small farmer
Future Outlook and Recommendations
Strengthening MSP System
- Expand Crop Coverage: Include more crops in MSP framework
- Improve Procurement Infrastructure: Better storage and logistics
- Market Integration: Link MSP with market development
- Price Rationalization: Regular review of MSP calculation methodology
Enhancing Support Schemes
- Universal Coverage: Extend benefits to tenant farmers and agricultural laborers
- Amount Rationalization: Increase PM-KISAN amount based on inflation
- Technology Upgrade: Further digitalization of all processes
- Convergence: Better coordination between different schemes
Infrastructure Development
- Accelerate AIF Implementation: Achieve full ₹1 lakh crore target
- Value Chain Development: Focus on processing and marketing infrastructure
- Technology Adoption: Promote modern agricultural technologies
- Climate Resilience: Develop climate-smart infrastructure


