Content
- An avoidable tragedy
- An Engels’ pause in an AI-shaped world
- What an Empty Plate of Food Should Symbolize
An avoidable tragedy
What happened?
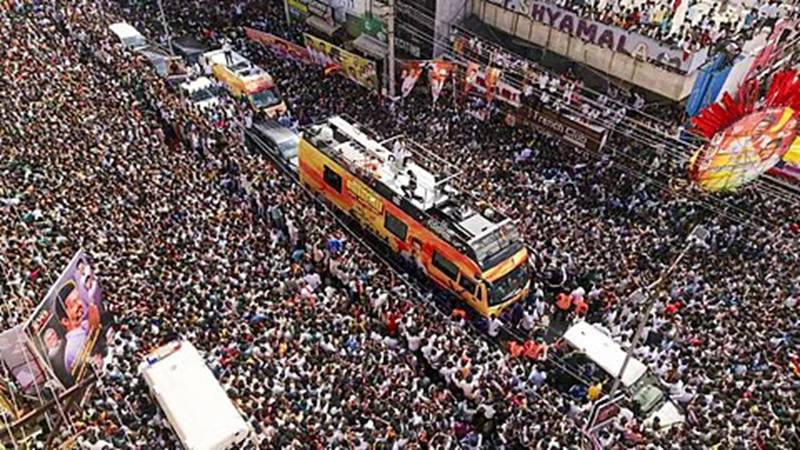
- Incident: At a roadshow in Karur, Tamil Nadu, by actor-politician C. Joseph Vijay, overcrowding led to a stampede-like situation, killing 40 people (including children).
- Cause: Mismatch between expected turnout (10,000) and actual turnout (27,000+), inadequate crowd control, lack of police enforcement, and unsafe practices (climbing poles, carrying children in crowds).
- Immediate Response: State government arranged medical aid, swift autopsies, and CM M.K. Stalin avoided politicisation by ordering a commission of inquiry.
Relevance:
- GS-2 (Polity & Governance): Role of state in public safety, police accountability, law & order, freedom of assembly (Art. 19(1)(b)) vs right to life (Art. 21).
- GS-3 (Disaster Management & Security): Man-made disasters, crowd management, NDMA guidelines, public safety infrastructure.
Practice Questions:
- Critically analyse India’s preparedness for crowd management in large-scale public events; suggest reforms in line with NDMA guidelines.(250 Words)
Core Issues Identified
- Crowd Management Failure: Organisers and police underestimated numbers, failed to regulate inflow, and allowed unsafe practices.
- Political Star Power vs Public Safety: Actor-politicians rely on fan-based charisma but roadshows create bottlenecks in dense areas.
- Institutional Weakness: High Court warned about property damage, even suggested deposits from political parties, but enforcement remained weak.
- Cultural Factor: Celebrity mystique in Tamil Nadu politics → fans take extreme risks for a glimpse, leading to heightened vulnerabilities.
Editorial’s Stand
- Against Roadshows in Dense Areas: Such venues inherently unsafe; large open grounds are better.
- Responsibility of Leaders: Vijay did little to restrain supporters; could have managed crowd behaviour by frequent appearances to reduce frenzy.
- Police Role: Must not succumb to political pressure or celebrity status; enforce restrictions independently.
- Institutional Learning: Commission must examine not only the party’s lapses but also systemic failures in policing and regulation.
Counter-Arguments
- Freedom of Assembly: Political roadshows are part of democratic rights (Article 19(1)(b)); excessive restrictions can be framed as politically motivated.
- Spontaneity of Crowds: Even with planning, celebrity charisma makes turnout unpredictable. Police can’t always anticipate real numbers.
- Responsibility of Attendees: Citizens knowingly take risks; overburdening organisers or police ignores personal accountability.
- Political Competition Angle: Over-regulation of new parties’ rallies may be seen as incumbents suppressing challengers.
Broader Dimensions
- Governance & Institutional Trust:
- Courts intervene when state machinery fails (e.g., Madras HC requiring deposits). But judicial solutions are piecemeal.
- Need a codified National Policy on Crowd Management (as recommended by NDMA 2014 guidelines post Kedarnath tragedy).
- Democracy vs Populism:
- Actor-politicians depend on spectacle to mobilise first-time supporters.
- This creates tension between mass mobilisation as democratic expression and public safety as governance obligation.
- Political Culture in Tamil Nadu:
- Legacy of M.G. Ramachandran, Jayalalithaa, Rajinikanth’s near-entry into politics → fan clubs are quasi-political bodies.
- Fan-politics creates emotion-driven gatherings with weak institutional control.
- Ethical Dimension:
- Leaders must balance ambition with safety.
- State has a duty of care under Article 21 (right to life) to prevent foreseeable tragedies.
Way Forward
- Structural:
- Mandatory risk assessment before granting rally permissions.
- Use of digital registration & crowd caps for political events.
- Stronger coordination between organisers, police, health services.
- Political:
- Leaders must consciously discourage unsafe practices.
- Regulatory:
- Enforce NDMA crowd management guidelines.
- Make organisers legally liable for negligence.
- Technological:
- Use of drones, surveillance, real-time crowd density monitoring.
- SMS alerts or online live streams to reduce physical rush.
Major Stampede Incidents in India (2025)
Karur, Tamil Nadu – Political Rally (September 27)
- Fatalities: 40 (including 9 children)
- Injuries: 83–124
- Cause: Overcrowding due to underestimation of crowd size; official estimate was 10,000, but actual turnout was over 27,000.
Prayagraj, Uttar Pradesh – Maha Kumbh Mela (January 29)
- Fatalities: Officially 37; unofficial reports suggest more.
- Injuries: 60–200
- Cause: Crowd surge caused by broken barriers and inadequate crowd control during the holy dip at the confluence of Ganges, Yamuna, and Saraswati rivers.
New Delhi Railway Station (February 15)
- Fatalities: 18
- Injuries: 15
- Cause: Overcrowding on a narrow footbridge between platforms 14 and 15, exacerbated by sudden train platform changes and overbooking during the Maha Kumbh festival.
Bengaluru – RCB IPL 2025 Trophy Parade (June 4)
- Fatalities: 11
- Injuries: 56
- Cause: Overcrowding during celebrations of Royal Challengers Bengaluru’s maiden Indian Premier League title win.
- Contributing Factors: Underestimation of crowd size; stadium capacity was 35,000, but attendance was estimated to be between 200,000 and 300,000.
An Engels’ pause in an AI-shaped world
Context :
- AI Revolution: Geoffrey Hinton, Nobel laureate, warns that AI may disproportionately enrich a few while leaving the majority behind.
- Historical Analogy: The concept of an Engels’ pause originates from 19th-century Britain where industrial output surged, but wages and living standards stagnated. Named after Friedrich Engels and formalized by Robert Allen, it reflects a period of rapid productivity gains without broad-based welfare improvement.
- Modern Relevance: With AI as a general-purpose technology (GPT)—like electricity or the steam engine—there’s concern that current technological growth may repeat historical inequities.
Relevance:
- GS-3 (Economy & Technology): Artificial Intelligence, general-purpose technologies, labor market impact, economic inequality, productivity vs wages.
- GS-2 (Polity & Governance): Policy interventions for reskilling, social safety nets (UBI, robot taxes), equitable AI deployment.
Practice Questions:
- Explain the concept of “Engels’ pause” and analyse its relevance in the age of AI, citing examples from IT and service sectors.(250 Words)
Key dynamics identified:
- Productivity vs. Wages:
- Example: AI copilots in Philippines call centers increased productivity by 30–50%, but worker wages remained stagnant or workload increased.
- Indian IT sector: 12,000 jobs shed amid AI pivot, illustrating early displacement.
- MIT study: 95% of AI pilots fail to generate visible organizational gains due to frictions in complementary capabilities.
- Capital and Skill Displacement:
- GPTs often benefit owners of capital and early adopters disproportionately.
- Prof. Nicholas Crafts and Bojan Jovanović’s studies show that historical pauses emerge when technology enhances capital returns but fails to benefit labor immediately.
- Complementary Needs:
- AI productivity gains require complements: cloud computing, data access, cybersecurity, reskilling programs.
- Rising costs of staying relevant: coding bootcamps, certifications, continuous learning—paralleling 19th-century rising food costs.
- Unequal Distribution of Gains:
- PwC: AI could add $15.7 trillion to global GDP by 2030, concentrated in US, China, UAE.
- IMF 2024: 40% of jobs globally exposed to AI; high-skilled economies see faster substitution, deepening inequality.
Empirical Markers of a Modern Pause
- Stagnant Wages Despite Productivity: Evidence from call centers, IT sector layoffs.
- Rising Costs of Complements: Investment in AI infrastructure, training, and cybersecurity.
- Job Displacement & Task Transformation: Examples:
- Tsinghua University: AI-powered hospital transforming healthcare delivery.
- GMR Airports: AI-driven automation impacting workforce tasks.
- Education, finance, and public administration witnessing early displacement.
- Concentration of Gains: Dominance of a few firms controlling foundational AI models.
Arguments Presented
- For Engels’ Pause Analogy:
- Early productivity gains benefit capital, not labor.
- Skills mismatch delays broad-based adoption.
- Historical precedent: Gilded Age US—high productivity, rising inequality, labor unrest.
- Against/Counterarguments:
- Modern welfare systems, democratic institutions, and technology diffusion are stronger than 19th century.
- AI’s potential in healthcare, education, and energy may deliver immediate welfare benefits.
- Rapid adoption of smartphones shows potential for fast technology-driven welfare improvements.
- Engels’ pause might be shorter and avoid prolonged stagnation if governance and reskilling keep pace with AI adoption.
Policy Implications
- Skilling & Reskilling Programs:
- Singapore’s SkillsFuture and Abu Dhabi’s MBZUAI as global examples of continuous AI education.
- Policies must target AI-specific human capital to reduce labor displacement.
- Redistribution of AI Gains:
- Robot taxes, Universal Basic Income experiments (UK, EU), and philanthropic interventions like Chan-Zuckerberg Initiative.
- Public Infrastructure:
- Treat compute and data as public goods to ensure equitable access.
- Support open AI models (K2Think.ai, Apertus) to democratize productivity benefits.
- Governance and Regulation:
- Monitor AI deployment to prevent oligopolistic concentration of benefits.
- Encourage sectoral adoption strategies ensuring labor is not excluded from gains.
Other Dimensions
- Historical Resonance: Engels’ pause shows macro gains without micro-level welfare improvements. Political economy teaches that outcomes depend on policy, institutions, and social structures.
- Global Perspective: Emerging economies (India, Philippines) may experience intensified pauses due to global tech races and IP regimes that favor developed nations.
- AI as a GPT: Full benefits require complementary innovations, task restructuring, and institutional adaptation—delays in these amplify inequality.
- Political Economy Lesson: AI gains must translate into human welfare, not just shareholder returns. Progress delayed for large labor segments risks social and political instability.
Conclusion
- Takeaway: The AI Engels’ pause is not inevitable but requires proactive governance, reskilling, redistribution, and infrastructure access.
- Policy Challenge: Transform AI from a productivity revolution into a human welfare revolution.
- Historical Warning: As Friedrich Engels’ analysis showed, delayed progress disproportionately harms the majority. The modern pause can be shortened or avoided if policymakers act decisively.
What an Empty Plate of Food Should Symbolize
Introduction
- Context: September 29 is observed as the International Day of Awareness of Food Loss and Waste (IDAFLW), highlighting the global challenge of food wastage, which undermines both food security and climate goals.
- Global Magnitude: Roughly one-third of all food produced worldwide is lost or wasted annually.
- India’s Situation: As one of the largest producers, India faces substantial post-harvest losses across crops, with significant economic, nutritional, and environmental consequences.
Relevance:
- GS-3 (Environment & Agriculture): Food security, post-harvest losses, climate change, SDG 12.3, GHG emissions, sustainable agriculture.
- GS-2 (Polity & Governance): Policy initiatives for food loss reduction (PMKSY), multi-stakeholder coordination, circular economy.
Practice Questions:
- Examine the economic and environmental impact of food loss in India; suggest policy and technological interventions to reduce it.(250Words)
Scale of the Problem in India
- Economic Cost: NABCONS (2022) estimates ₹1.5 trillion annually, roughly 3.7% of agricultural GDP, lost due to post-harvest wastage.
- Crop-wise Losses:
- Fruits & vegetables: 10–15%
- Paddy: 4.8%
- Wheat: 4.2%
- Environmental Cost: Wasted food also represents lost water, energy, and labor, while contributing to GHG emissions.
- National Impact: Millions of tonnes of food lost annually affect farmer incomes, food availability, and environmental sustainability.
Food Loss & Climate Connection
- GHG Emissions: FAO-NIFTEM study with Green Climate Fund (GCF) support shows:
- 30 major crops and livestock products analyzed
- 10+ million tonnes CO₂-equivalent emissions from rice alone due to methane intensity
- Total losses: 33 million tonnes CO₂-e per year—a preventable environmental burden
- Location of Losses: Predominantly early in the supply chain (handling, processing, transport), unlike high-income countries where consumer-level waste dominates.
- Significance: Reducing food loss directly supports India’s climate commitments and aligns with SDG 12.3.1 for food loss and waste reduction.
Drivers & Challenges
- Infrastructure Gaps: Weak cold chains, inadequate storage, and fragmented logistics increase spoilage.
- Technology Gaps: Limited adoption of IoT, AI, and other digital tools for monitoring and forecasting.
- Smallholder Constraints: High capital costs, lack of affordable storage solutions, and low access to modern tools.
- Systemic Challenges: Dispersed production, variable quality, and inadequate market linkages.
Proposed Solutions
- Infrastructure Strengthening:
- Cold storage modernization, refrigerated transport, pre-cooling units
- PMKSY (Pradhan Mantri Kisan SAMPADA Yojana) to develop agro-processing clusters
- Moisture-proof silos for grains, low-cost cooling chambers for perishables
- Technology & Innovation:
- IoT sensors, AI-driven demand forecasting
- FAO Food Loss App (FLAPP) tracks losses across value chains, now in 30+ countries
- Solar-powered cold storage for smallholders
- Circular Economy Approaches:
- Surplus food redirected to food banks/community kitchens
- Unavoidable waste converted to compost, feed, bioenergy
- Policy & Governance:
- Subsidies, low-interest loans, and credit guarantees to incentivize infrastructure investments
- Integration of loss reduction into climate strategies and SDGs
- Shared Responsibility:
- Government: Invest in resilient logistics and policy frameworks
- Private Sector: Adopt circular models, scale innovations
- Civil Society/Academia: Drive research, awareness campaigns
- Consumers: Mindful purchasing and consumption practices
Arguments in the Editorial
- Economic Argument: Post-harvest losses cost ₹1.5 trillion/year; addressing it boosts agricultural GDP, farmer incomes, and food security.
- Environmental Argument: Food wastage contributes 33 million tonnes CO₂-e annually, undermining climate targets.
- Social Argument: Reducing losses improves nutrition, particularly for vulnerable populations.
- Technological Argument: Adoption of cold chains, AI, IoT, and circular economy solutions can drastically reduce waste.
- Moral Argument: An empty plate should symbolize conscious consumption and resource preservation, not inefficiency.
Counterarguments & Challenges
- Implementation Gap: Large-scale infrastructure and tech adoption requires significant capital and coordination.
- Behavioral Barriers: Consumer-level waste and lack of awareness remain challenges.
- Fragmented Policy Execution: Coordination across central ministries, states, and private players is complex.
- Climate Uncertainty: Extreme weather events may continue to exacerbate pre- and post-harvest losses.
Data & Facts Summary
| Parameter | Data/Facts | Implication |
| Economic loss | ₹1.5 trillion/year (~3.7% of agri GDP) | Major economic inefficiency |
| Crop loss rates | Fruits/veg 10–15%, paddy 4.8%, wheat 4.2% | Vulnerable commodities identified for targeted interventions |
| GHG emissions | 33 million tonnes CO₂-e/year | Environmental footprint of losses |
| FAO/NIFTEM study | 30 crops/livestock products analyzed | Evidence-based policymaking possible |
| Supply chain location | Mostly pre-consumer (handling, processing, distribution) | Focus infrastructure improvements on early stages |
Advanced Overview
- Economic Efficiency: Reducing food loss improves resource productivity—water, labor, and energy—across the agricultural sector.
- Climate Co-benefits: Lower emissions from reduced waste, better energy use, and circular economy solutions.
- Strategic Opportunity: India can emerge as a global leader in food loss reduction, integrating innovation, finance, and policy frameworks.
- Long-term Vision: Aligns with Net Zero, SDGs, and India’s climate-resilient agriculture goals, making food systems more sustainable and equitable.
Conclusion
- Editorial Takeaway: Food loss is a silent crisis with economic, social, and environmental dimensions.
- Actionable Insight: Solutions exist—cold chains, AI/IoT, circular economy, policy support, and consumer behavior changes.
- Symbolism: An empty plate should represent responsible consumption and resource preservation, not inefficiency or waste.
Value Addition
Global Food Wastage
- Annual Wastage: Nearly one-third of all food produced globally is lost or wasted each year, amounting to about 1.05 billion tonnes.
Source: FAO, 2021, “Food Loss and Waste Facts” - Per Capita Waste: On average, 79 kg of food is wasted per person per year globally.
Source: FAO, 2021 - Household Contribution: Households account for about 60% of global food waste.
Source: The Guardian, 2024, “A fifth of food wasted globally” - Economic Impact: Global food wastage costs roughly USD 1 trillion annually.
Source: The Guardian, 2024 - Environmental Impact: Food loss and waste contribute 8–10% of annual global greenhouse gas (GHG) emissions.
Source: UNFCCC, 2023
Food Wastage in India
- Annual Loss: India loses about 74 million tonnes of food annually, roughly 22% of its foodgrain output.
- Economic Cost: Post-harvest losses cost India approximately ₹1.5 trillion per year, about 3.7% of agricultural GDP.
Source: NABARD Consultancy Services (NABCONS), 2022, report commissioned by MoFPI - Per Capita Waste: Average Indian household wastes 55 kg of food per person per year.
Source: FCAI Report, 2023 - Sectoral Losses:
- Fruits and vegetables: 10–15% loss
- Paddy: 4.8% loss
- Wheat: 4.2% loss
Source: DowntoEarth, 2024
- Climate Impact: Losses from 30 major commodities (cereals, fruits, vegetables, livestock) generate over 33 million tonnes of CO₂-equivalent emissions annually.
Source: FAO-NIFTEM study with Green Climate Fund support, 2023 - Supply Chain Challenge: Most food losses in India occur early in the supply chain—during handling, storage, processing, and distribution—unlike in high-income countries where consumer-level waste predominates.
Source: FAO-NIFTEM study, 2023
Key Takeaways for Policy and Governance
- Infrastructure Gaps: Poor cold chains, inadequate storage, and fragmented logistics contribute to early-stage losses.
Source: FAO-NIFTEM, 2023 - Technological Solutions: Solar cold storage, low-cost silos, IoT-based monitoring, and AI forecasting can reduce spoilage.
Source: FAO, 2023; FLAPP, 2023 - Government Initiatives:
- Pradhan Mantri Kisan SAMPADA Yojana (PMKSY): Modernizes agro-processing and cold chain infrastructure.
Source: MoFPI, Government of India, 2023
- Pradhan Mantri Kisan SAMPADA Yojana (PMKSY): Modernizes agro-processing and cold chain infrastructure.
- Circular Economy Practices: Food banks, redistribution, composting, and bioenergy conversion help minimize losses at retail and consumer levels.
Source: FAO, 2023 - Climate & SDG Linkage: Reducing food wastage contributes directly to SDG 12.3 (halving global food loss and waste) and India’s climate commitments.
Source: NITI Aayog, 2023; FAO, 2023


