Content
- China’s Global Lending Power Play
- Draft Seeds Bill
- Air Pollution Exposure in India
- INR Depreciation
- Why Did Hayli Gubbi Erupt Now?
- Climate Change and Assam’s Tea Crisis
China’s Global Lending Power Play
Why is it in News?
- AidData (William & Mary University) released a major dataset (2000–2023) showing China lent over $2 trillion to 80%+ of the world, revealing a strategic shift from development lending to commercial lending.
- Shows unexpected top beneficiaries: U.S. firms received ~$200 billion, making the U.S. the largest single-country beneficiary.
- Data indicates: BRI’s decline, shift to high-income economies, and greater opacity through offshore structures.
Relevance:
GS2 – International Relations
- China’s transformation from development lender → commercial financier.
- Rise of parallel financial architecture challenging WB–IMF dominance.
- Strategic leverage through corporate lending, tech acquisition, and supply-chain influence.
GS3 – Economy
- Global credit flows, debt sustainability, hidden debt risks.
- Impact on developing economies’ fiscal health and India’s external sector.
Basics: What is Chinese Global Lending?
- State-driven external finance system led by:
- China Development Bank
- Export–Import Bank of China
- State-owned enterprises
- People’s Bank of China
- Two broad categories:
- Official Development Assistance (ODA) → concessional, development-oriented.
- Other Official Flows (OOF) → commercial, market-rate, strategic.
Key Data & Trends (2000–2023)
Scale
- Total global lending/grants: >$2 trillion.
- Recipients: 179 of 217 countries/territories.
- 2023 lending alone: $140 billion → makes China the world’s largest creditor.
Top beneficiaries (country entities)
- U.S. companies: ~$200 billion (2,500 projects; 95% from Chinese state-owned institutions).
- Russia: $172 billion.
- Australia: $130 billion.
- EU (27 states): $161 billion.
Shift in beneficiary profile
- High-income countries received $943 billion → ~20%+ of total Chinese lending.
- Only 25% of 2023 portfolio is now BRI-linked, down from 75% earlier.
Decline in aid
- Typical annual China ODA: ~$5.7 billion.
- 2023 ODA plunged to $1.9 billion.
Sectoral pattern
- Earlier: Infrastructure → energy, transport, connectivity.
- Now: Commercial finance → mergers, acquisitions, corporate lending.
Structural Shift: From Aid Provider to Commercial Financier
Earlier Model (2000–2015)
- Focus on:
- Low-income nations
- BRI infrastructure
- Strategic influence + resource access
- Concessional loans, long maturity, tied procurement.
Current Model (2016–2023)
- Pivot to high-income economies for:
- Access to advanced technologies
- Financial returns
- Corporate stakes
- U.S. lending surged from $320 million (2000) → $19 billion (2023).
- 75% of U.S. transactions are commercial; only 7% developmental.
Methods & Concerns Raised by AidData
- 80% success rate in overseas M&A approvals due to:
- Weak foreign investment screening in recipient countries.
- Opaque mechanisms:
- Use of offshore shell companies.
- Syndicated international banks.
- Complex creditor structures reducing transparency.
- Rising risk of hidden debt in low-income countries.
Implications for Global Finance & Geopolitics
For Global Financial Architecture
- China emerging as:
- Largest official creditor, surpassing World Bank + IMF individually.
- Parallel financial ecosystem → reduces Western institutional dominance.
For Developed Economies
- China’s commercial lending → deeper corporate penetration.
- Strategic concerns around:
- Technology acquisition
- Supply chain leverage
- National security vulnerabilities
For Developing Countries
- Decline in aid → widening financing gap for:
- Infrastructure
- Social development
- Increased exposure to:
- Debt distress
- Collateral-backed lending (ports, minerals)
For BRI
- Downscaling but not disappearing.
- Prioritisation of:
- Quality over quantity
- Higher-return projects
- Geopolitical essentials
India Angle
- Total Indian borrowing/aid from China (2000–2023): $11.1 billion.
- Sectors:
- Energy
- Banking & financial services
- Nature: Mix of commercial + developmental.
- India remains cautious due to:
- Strategic competition
- Supply chain dependencies
- Security concerns (FDI scrutiny after 2020)
Draft Seeds Bill Entail
Why is it in News?
- The Union Agriculture Ministry released the draft Seeds Bill on November 12, 2025; public comments invited till December 11.
- Objective: update and modernise the Seeds Act, 1966 and the Seeds (Control) Order, 1983 in line with technological advances, commercial changes, and global commitments.
- Comes amid rising tensions between seed industry demands (modernisation) and farmers’ unions’ concerns (corporatisation & seed sovereignty).
Relevance:
GS2 – Governance / Policy
- Overhaul of Seeds Act, 1966; regulatory modernisation.
- Centre–State regulatory overlap, federal tensions.
- Alignment with PPVFR Act, CBD, ITPGRFA → treaty compliance.
GS3 – Agriculture
- Seed quality standards → productivity, crop failure reduction.
- Impact on small farmers, seed sovereignty, traditional varieties.
- Liberalising imports → biosecurity, corporate consolidation risks.
Why a Seeds Law?
- Seeds are the primary determinant of crop productivity (35–40% contribution).
- India has moved from:
- 1960s: Public-sector dominated seed systems
- 2020s: Hybrid technologies, GM traits, corporate breeding, biotech, global IPR regimes
- Need for:
- Quality assurance
- Traceability
- Regulation of producers/dealers
- Alignment with PPVFR Act (2001) and biodiversity conventions
History & Context
- Seeds Act, 1966 and Seeds (Control) Order, 1983 now outdated.
- Seed industry demand:
- Law must reflect advancements in biotechnology, hybrid seeds, transgenics, R&D intensity, global trade.
- India’s seed requirement 2023–24: 462.31 lakh quintals
- Availability: 508.60 lakh quintals → 46.29 lakh quintal surplus
- Farmers’ unions’ position: fear of corporatisation, loss of seed sovereignty, and restriction of farmers’ traditional practices.
New Provisions: What the Draft Bill Proposes
Regulatory Architecture
- Covers import, production, processing, certification, distribution, sale of seeds.
- New definitions for farmer, dealer, distributor, producer.
Farmers’ Rights
- Farmers retain right to grow, sow, re-sow, save, exchange, share, sell farm-saved seed.
- Restriction only when seed is sold under a brand name.
- Embedded link to Protection of Plant Varieties and Farmers’ Rights (PPVFR) Act, 2001.
Institutional Framework
- Central Seed Committee (27 members) → sets:
- Minimum standards on germination, genetic purity, physical purity, seed health, traits.
- State Seed Committees (15 members) → registration of:
- Seed producers
- Seed processing units
- Dealers/distributors
- Plant nurseries
Seed Registration & Testing
- Mandatory registration of all:
- Seed producers
- Seed processing units
- Provision for:
- National Register of seed varieties
- Field trials for Value for Cultivation & Use (VCU)
- Central & State seed testing laboratories
Import Liberalisation
- More open system for seed imports, with quality safeguards.
Central Accreditation System
- Merit-based accreditation for companies operating in multiple States to reduce compliance burden.
Enforcement Mechanism
- Seed inspectors empowered to search, seize, sample, and test.
- Framework aligned with Bharatiya Nagarik Suraksha Sanhita (BNSS).
Offences & Penalties: What Has Changed from 2019 Draft?
Changes from 2019 Draft
- Earlier penalties (2019):
- ₹25,000–₹5 lakh, imprisonment up to 1 year.
- Covered largely under consumer protection laws.
New Draft (2024)
- Penalties significantly enhanced:
- ₹50,000 to ₹30 lakh
- Imprisonment up to 3 years
- Categorisation into trivial, minor, major offences.
- Much stronger punitive framework to curb:
- Misbranding
- Spurious seed sales
- Fake labels
- Trait misrepresentation
Farmers’ Concerns
Key objections by All India Kisan Sabha (AIKS) / Samyukt Kisan Morcha
- Bill will increase cost of cultivation due to:
- Corporate entry
- Potential for predatory pricing
- Seen as part of a centralised, corporatised regulatory architecture.
- Fear of:
- Undermining India’s seed sovereignty
- Weakening of farmer-centric protections
- Dilution of biodiversity safeguards
Legal & International Commitments Farmers Invoke
- Must not conflict with:
- PPVFR Act, 2001 (farmers’ rights)
- Convention on Biological Diversity (CBD)
- International Treaty on Plant Genetic Resources (ITPGRFA)
Major apprehensions
- Centralised regulation may:
- Reduce autonomy of States
- Increase dependence on corporate seed lines
- Marginalise traditional varieties
Industry’s Position
- Federation of Seed Industry of India:
- Calls the draft timely and much-needed.
- Supports:
- Higher standards
- Liberalisation of imports
- Accreditation-based regulation
- Clear penalties
- Says it aligns India with global seed trade standards.
Critical Analysis
Strengths
- Updated quality standards → reduced spurious seeds, higher yields.
- Clarity on farmers’ rights → compliance with PPVFR Act.
- Modernised regulation → ease of doing business for legitimate players.
- Strong penalties → deterrence against adulteration.
- National Register + lab network → greater traceability and transparency.
Weaknesses / Risks
- Centralisation risks limiting State autonomy (Key in agri-sector).
- Liberal import regime → risk to domestic breeders, biosecurity.
- Accreditation system may favour large corporations.
- VCU trials may increase cost and time, disadvantaging small breeders.
Opportunities
- Harmonisation with global standards → export potential for Indian seed industry.
- Improved seed quality → reduced crop failures, higher productivity.
- Stimulates R&D, hybrid seed development, biotech innovation.
Threats
- Corporate consolidation → increased input costs.
- Farmers’ distrust → protests, political backlash.
- Inadequate protection for traditional varieties → biodiversity loss.
Air Pollution Exposure in India
Core Findings
- 60% districts (447/749) record annual PM2.5 above NAAQS (40 µg/m³).
- 0 districts meet WHO guideline (5 µg/m³).
- Indicates year-round exposure, not only winter-linked.
Relevance:
GS3 – Environment
- India-wide PM2.5 exposure trends; compliance gap with NAAQS/WHO standards.
- Seasonal divergence (winter vs monsoon) → atmospheric science relevance.
- Urban–rural health burden; link to climate–pollution interactions.
GS2 – Governance
- Air quality regulation, monitoring deficits, federal coordination challenges.
- Policy gaps in Clean Air Programme, emission control, district-level planning.
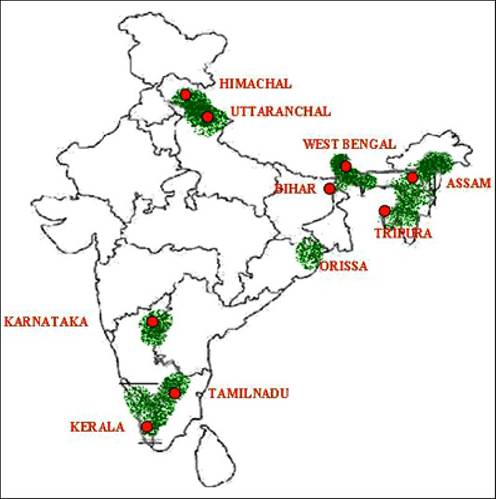
Geographical Pattern
- Major hotspots (Top 50 districts)
- Delhi – 11
- Assam – 11
- Bihar – 7
- Haryana – 7
- UP – 4
- Tripura – 3
- Rajasthan – 2
- West Bengal – 2
- Cleaner States (mostly within NAAQS)
- AP, Telangana, Kerala, Sikkim, Goa, Karnataka, Tamil Nadu
- Indicates North–East and North dominance vs South–Coastal cleaner belt.
Seasonality
- Winter (Dec–Feb)
- 82% districts (616/749) exceed NAAQS.
- Reasons: stable atmosphere, low wind, increased emissions.
- Monsoon (Jun–Sep)
- 90% districts within safe limits (675/749) due to rain scavenging.
Technical Notes
- PM2.5 = toxic chemical + organic aerosol particles.
- Population exposure differs from ambient readings due to population density distribution.
- Study by Centre for Research on Energy and Clean Air (CREA); not peer-reviewed.
INR Depreciation
Current Status
- INR = worst-performing Asian currency in 2025 (Jan–Dec CYTD).
- Depreciation: 4.3% vs USD (CYTD); 4% CYTD as per Axis Bank estimate.
- Recent movement: Broke RBI’s defended 88.8 level → touched 89.66 (21 Nov 2025) → recovered to 89.22.
Relevance:
GS3 – Economy
- Exchange-rate dynamics; comparison with Asian currencies.
- Drivers: strong USD, tariffs, gold imports, capital outflows.
- Trade deficit, external vulnerabilities, BoP pressures.
- Monetary policy implications; RBI intervention strategy.
GS2 – International Relations
- Impact of U.S. tariffs on India; geopolitical trade pressures.
- Currency as a geo-economic tool in India–U.S. relations.
Comparison with Asian Peers
- Indonesian Rupiah (IDR): –2.9% CYTD.
- Philippine Peso (PHP): –1.3% CYTD.
- Chinese Yuan (CNY): Appreciated due to PBOC/SAFE interventions.
- INR weaker vs Asia FX, especially vs current account surplus economies.
- Still stronger than JPY, KRW, which face domestic policy fragility.
Drivers of Depreciation
- Strong USD (global)
- USD appreciated 3.6% in last two months → pressure across emerging markets.
- U.S. Tariffs on India (Trump administration)
- 50% tariff on Indian exports.
- Triggered record trade deficit: $41.7 bn (Oct 2025).
- Direct negative impact on export competitiveness.
- Surge in Gold Prices & Imports
- Massive spike in global gold prices → investors shifted to gold & Gold ETFs.
- Gold demand up 200% (Oct).
- Gold import bill = $14.72 bn (Oct) → worsened trade deficit.
- Capital Outflows
- Depreciation pressure not due to current account (benign).
- Due to portfolio outflows amid global risk-off and high USD yields.
- Adverse Geo-economic Environment
- Combination of tariffs, commodity price shock, and geopolitical instability affecting trade flows.
Forward Outlook
- INR may slide to 90/USD if India–U.S. trade deal is delayed.
- Rupee trajectory dominated by global USD strength, not domestic fundamentals.
Why did Hayli Gubbi erupt now ?
Why is it in News?
- Erupted on 23 November 2025 after being dormant for ~12,000 years.
- Produced an explosive ash-rich eruption, unusual for a shield volcano.
- Located in the Afar Region, a tectonically sensitive area within the East African Rift System.
- Eruption monitored mainly via satellite imagery due to remoteness.
Relevance:
GS1 – Geography
- Shield volcano characteristics; Afar Rift tectonics; triple-junction dynamics.
- Dormant volcano reactivation after millennia; magma chemistry.
- Rift-related volcanism → creation of future ocean basin.
GS3 – Disaster Management
- Monitoring challenges in remote volcanic systems.
- Role of satellite-based early warning; preparedness gaps.
What is a Shield Volcano?
- Broad, gently sloping volcanic structure.
- Formed by multiple thin, fluid basaltic lava flows.
- Low viscosity magma → flows long distances → “warrior’s shield” shape.
- Typically non-explosive eruptions due to low gas content.
Location & Tectonic Setting
- Situated in Afar, Ethiopia, part of the Erta Ale volcanic range.
- Lies on the boundary of:
- African Plate
- Arabian Plate
- Region forms a triple junction (Afar Triple Junction).
- Part of the active East African Rift, where continents are pulling apart (divergent plate boundary).
Geological Composition of Hayli Gubbi
- Dominantly basaltic lava (dark, fluid).
- Also contains trachyte and rhyolite (higher silica content).
- High-silica magma → more viscous → traps gases → explosive potential.
Why Did the Eruption Occur Now After 12,000 Years?
Tectonic Drivers
- Rifting continues → plates pulling apart.
- This allows hot mantle material to rise.
Magma Generation
- Rising mantle undergoes partial melting.
- Fresh magma accumulates in shallow crustal chambers.
Long-term Magma Buildup
- Over millennia:
- Magma slowly pressurises surrounding rocks.
- Gas-rich, silica-rich pockets evolve.
Crustal Faulting or Cracking
- Rifting causes fault slippage or crustal fractures.
- A new pathway to the surface opens suddenly.
Sudden Ascent of Gas-Rich Magma
- Once pathway opens:
- Pressurised magma rises rapidly.
- Dissolved gases expand into bubbles → explosive eruption.
- Explains why a shield volcano (usually gentle) produced ash-heavy explosive activity.
Why Was It Explosive This Time?
- Presence of more silica-rich magmas (trachyte, rhyolite).
- These magmas:
- Viscous, slow-flowing → gas cannot escape.
- High gas content → explosive release when decompressed.
- Long dormancy → pressure buildup significant.
Monitoring Challenges
- Region is remote, poorly instrumented.
- Very limited seismic stations, gas sensors, ground deformation tools.
- Scientists rely on:
- Satellites (thermal anomalies, ash plume movement).
- Ash chemistry samples.
- Infrasound and remote radar.
- Current assessments are provisional, pending better data.
Broader Geological Significance
- Shows that rift-zone volcanoes can reawaken after millennia.
- Demonstrates mixed-magma systems in shield volcanoes.
- Highlights the dynamic nature of the East African Rift → one of the few places on Earth where a new ocean basin is forming.
Case Study : Climate Change and Assam’s Tea Crisis
Why is it in News?
- Persistent heat, delayed rainfall, high humidity continue into November, disrupting Assam’s traditional post-monsoon cooling.
- Unpredictable weather causing wilting, blackening, and irregular flush cycles, hitting productivity and quality.
- Climate change + stagnant prices squeezing margins of tea growers and estates.
- New research using 50 years’ climate data + IPCC RCP 2.6 & 4.5 models shows suitability decline by 2050, forcing tea cultivation to shift to higher altitudes.
- Tea tribes (a major workforce constituency) becoming a key factor ahead of Assam 2026 elections.
Relevance:
GS1 – Geography
- Climate–crop interactions; temperature/rainfall variability.
- Regional vulnerability: floodplains, monsoon dependence.
GS3 – Environment & Agriculture
- Climate impacts on productivity, quality, pest outbreaks.
- Modelling (RCP scenarios) → future suitability shifts to higher altitudes.
- Adaptation technologies: irrigation, clonal varieties, agroforestry.
GS2 – Governance / Social Issues
- Tea tribes’ socio-economic vulnerability.
- Labour rights, health impacts, political relevance ahead of 2026 elections.
Tea Basics — The Science of the Crop
- Optimal temperature: 13–28°C, best growth at 23–25°C.
- Optimal rainfall: 1,500–2,500 mm, evenly distributed.
- Soil: Acidic (pH 4.5–5.5), deep, well-drained, high organic matter.
- Growth pattern: Continuous but in flush cycles, driven by temperature + moisture.
- Quality determinants: Flavour and aroma depend on slow growth, cool nights, and predictable rainfall.
What Climate Change Is Doing to Assam’s Tea
Temperature
- Mean minimum temperature rise of 1°C over 90 years → destroys night-time cooling needed for flavour compounds.
- More days >35°C → nutrient absorption falls; leaves wilt.
Rainfall
- Winter & pre-monsoon rainfall declining → poor early-season flush.
- Monsoon rainfall becoming erratic → flooding + soil nutrient leaching.
- ~200 mm annual rainfall loss over 90 years → chronic moisture stress.
Seasonality Shift
- Heat lingering till November → mismatched harvest cycles, disease risk rises.
Pests & Diseases
- Warmer, more humid conditions → explosion of red spider mite, tea mosquito bug, blister blight.
- New pest behaviour observed after night temperatures rose.
Impact on Tea Quality
- Reduced polyphenol and flavonoid formation → weaker aroma, lower global competitiveness.
Economic Stress: Weather Gets Worse, Prices Don’t Improve
- Tea auction price rise: only 4.8% per year for 30 years.
- Staples like wheat/rice: ~10% annual price rise.
- Real returns stagnant → growers cannot invest in new clones, irrigation, or R&D.
- Rising input costs: labour, energy, agrochemicals, logistics, irrigation.
- Ageing bushes (40–60 years old) + no funds for replantation → productivity stagnation.
Why Assam Tea Is Especially Vulnerable
- Grown in floodplains, not hills → hydrological stress higher.
- Monoculture plantations → low ecosystem resilience.
- High labour dependence → wages rise but productivity does not.
- Climate-sensitive product where quality directly follows weather cycles.
Social & Political Dimensions
- 12 lakh workers, majority women → highest climate vulnerability.
- Increased heat stress, mosquito-borne disease risk, water shortages.
- Wages stagnant, living conditions poor → climate shocks hit hardest.
- With elections due in 2026, tea tribes are emerging as a decisive political constituency.
- Issues gaining traction:
- Rising cost of living
- Poor housing & healthcare
- Climate-driven drop in working days
- Stagnant wages
Adaptation Pathways — What the Industry Is Trying
Agronomic Solutions
- Drought-resilient clonal varieties + seed-grown plants with deep roots.
- Mulching, cover cropping → retain soil moisture.
- Agroforestry → shade trees reduce heat, stabilise microclimate.
- Organic amendments → rebuild soil carbon.
Water Management
- Micro-irrigation, sprinklers, drip systems.
- Rainwater harvesting for dry patches.
- Drainage redesign to handle sudden downpours.
Pest Management
- Integrated Pest Management (IPM)
- Biological controls, pheromone traps, precision spraying.
Supply-Chain Reform
- trustea (India Sustainable Tea Code)
- 1.4 lakh small growers verified
- 6.5 lakh workers covered
- Focus on efficient water use, safe agrochemicals, shade cover, soil health.
Structural Reforms Needed
- Policy parity: treat tea as agriculture, not an industry only.
- Income diversification for estates:
spices, fruits, agri-tourism, livestock, fisheries, direct-to-consumer sales. - Investment in climate forecasting, early-warning systems.
- Subsidised replantation, drip irrigation, and disaster-compensation schemes (like MSP-linked crops).
Big Picture — The Tea–Climate Paradox
- Assam produces 50%+ of India’s tea and drives a $10 billion economy.
- Climate is becoming harsher just as global tea prices stagnate.
- Domestic labour, logistics, compliance costs rising → margins collapse.
- Without decisive adaptation + policy support,
India risks losing global leadership in premium tea.


