Content
- Telangana likely to get five more Geographical Indication (GI) tags soon
- Why manufacturing has lagged in India
- What is the Bureau of Port Security and its role?
- Did an ancient flood contribute to Keezhadi’s abandonment?
- ISRO rocket LVM-3 places 6000-kg US satellite — its heaviest — into orbit
- Only 1 in 4 marginal farmers in India linked to cooperatives, report finds
- Large share of India’s PM2.5 not emitted directly, but chemically formed in the atmosphere: CREA Study
Telangana likely to get five more Geographical Indication (GI) tags soon
Why is it in news?
- Telangana is close to securing five new Geographical Indication (GI) tags — Narayanpet jewellery making, Hyderabad pearls, Banjara tribal jewellery, Banjara needle craft, and Batik paintings — after completion of field studies and documentation.
- Additional GI applications are pending for Armoor turmeric, Nalgonda chitti dosakai, Kollapur Benishan mango, Mahadevpur tussar silk, Jagtial sesame, and Nayakpod masks.
- In the last two years, the State obtained two new GI tags — Hyderabad lac bangles (2024) and Warangal chapata chilli (2025) — taking the total to 18 GI-tagged products.
Relevance
- GS-III: Economy — Inclusive Growth, MSMEs, Rural Development
- GI-linked value addition, craft-cluster livelihoods, FPO linkages, women-led enterprises
- GS-I: Indian Culture & Heritage
- Protection of traditional crafts, tribal art, cultural identity
Telangana GI Ecosystem
- Total GI-tagged products (current): 18
- Includes: Pochampally Ikat, Adilabad Dokra, Warangal Durries, Hyderabad Haleem, etc.
- GI Authority: Geographical Indications Registry, Chennai (under DPIIT).
- Legal Basis: Geographical Indications of Goods (Registration and Protection) Act, 1999.
- Ownership & Value Effects
- Protects place-linked identity & brand premium
- Ensures exclusive usage rights to local producers
- Enables authentication & traceability
- Economic Linkages
- GI clusters typically show
- Price premium: 10–30% (avg. Indian handicrafts/food GIs)
- Higher rural employment multipliers in craft-based economies
- GI clusters typically show
- Cultural Impact
- Safeguards intangible heritage, artisanal skills, tribal crafts
- Strengthens community identity & transmission of traditional knowledge
Sectoral Significance of the Proposed GI Tags
- Banjara crafts (jewellery + needlework) → protects tribal livelihood chains, encourages women-led craft enterprises.
- Hyderabad pearls → reinforces historic trade heritage, boosts export-tourism branding.
- Narayanpet jewellery making → formal recognition to regional artisanal metalwork traditions.
- Batik paintings → strengthens handloom-art crossover markets and design innovation.
Takeaways
- GI = place-specific, collective intellectual property (not individual trademark).
- Registered under DPIIT; validity: 10 years; renewable.
- Pre-eminent Telangana GIs: Pochampally Ikat, Adilabad Dokra, Warangal Durries, Hyderabad Haleem.
- Recent additions: Hyderabad lac bangles (2024), Warangal chapata chilli (2025).
- Upcoming pipeline: Armoor turmeric, Kollapur Benishan mango, Mahadevpur tussar silk, etc.
Why manufacturing has lagged in India ?
Why is it in news?
- A recent discussion on A Sixth of Humanity by economist Arvind Subramanian revisits why India has lagged behind China and South Korea in industrialisation despite comparable starting points.
- The argument applies the ‘Dutch Disease’ framework to India — suggesting that high public-sector wages distorted labour markets, pulled workers away from manufacturing, raised domestic prices, appreciated the real exchange rate, and weakened manufacturing competitiveness.
- The debate reopens larger questions on technological upgradation, wage dynamics, inequality, and structural transformation in India’s growth model.
Relevance
- GS-III: Economy — Growth, Structural Transformation, Employment
- Manufacturing stagnation, wage–productivity dynamics, inequality
- GS-III: Industry & Infrastructure / Industrial Policy
- Technology adoption, export orientation, PLI, R&D ecosystem
Key Facts & Data
- Manufacturing share in GDP
- India: broadly 15–17% for three decades, declining recently relative to services
- China: rose from ~25% (1990s) to 28–30%+ during industrial boom
- South Korea: sustained 25–27% during export-led industrialisation
- Employment structure
- India: manufacturing employs ~11–12% of workforce; large informal share
- China/South Korea: manufacturing central to productivity & wage gains
- Wage dynamics in India
- Entry-level IT wages stagnant since early 2000s (real terms barely improved)
- Platform firms (Swiggy, Zomato, Ola, Blinkit) rely on labour-intensive, low-productivity models rather than technology-deepening
- Inequality signal
- Top-end wealth and corporate profits grew faster than median wage/productivity, indicating lop-sided growth.
Dutch Disease
- Originally used to study Netherlands’ 1959 Groningen gas discovery.
- Mechanism:
- Resource boom → higher wages & capital shift into booming sector
- Currency appreciation / price rise → imports cheaper, exports costlier
- Manufacturing becomes uncompetitive → stagnation or decline
- Extension to India (policy variant):
- Expansion of high-wage government sector → manufacturing cannot match wages at existing productivity
- Higher incomes raise domestic prices → real exchange-rate appreciation even without nominal rupee change
- Demand tilts toward cheaper imports, hurting local manufacturing.
Critical Interpretation of the Argument
- Strengths of the hypothesis
- Explains factor-market distortion: skilled labour moves to safer, better-paid government jobs
- Clarifies link between wages, prices, competitiveness, and structural transformation
- Limitations
- Classic Dutch-disease arises from natural-resource windfalls, not deliberate wage policy
- Ignores why firms did not upgrade technology over time to sustain higher wages
- Public sector wages may be symptom, not core cause, of weak industrial policy and ecosystem gaps.
Technology & Wage Question
- Induced-innovation theory (Habakkuk, Allen, Acemoglu)
- High wages → firms invest in automation, capital-biased technology → productivity & wage growth
- Seen in Germany, Japan, South Korea with labour scarcity
- India’s contrast
- Large labour reserves reduced incentive to automate
- Manufacturing became labour-absorbing but low-productivity, limiting wage growth
- Services growth did not diffuse productivity economy-wide.
Structural Bottlenecks Beyond Wages
- Shallow export orientation vs. East Asian export discipline
- Weak firm size-upgrading (missing middle; dominance of micro-units)
- Patchy industrial policy and cluster-level support
- Low R&D intensity and technology adoption
- Logistics, power, and compliance frictions historically higher than peers.
Policy Implications
- Shift from labour-abundance reliance to technology-deep manufacturing
- Strengthen export-linked manufacturing clusters and scale-up pathways
- Invest in skills, automation readiness, design & R&D
- Reform wage-productivity linkages: raise productivity alongside wages, not suppress wages
- Leverage PLIs, supply-chain localisation, semiconductors, electronics, green manufacturing with stronger technology absorption.
What is the Bureau of Port Security and its role?
Why is it in news?
- The Centre has constituted the Bureau of Port Security (BoPS) as a statutory body under Section 13 of the Merchant Shipping Act, 2025 to strengthen port and coastal security amid rising maritime, smuggling, piracy, and cybersecurity threats.
- The move coincides with major reforms in India’s maritime governance — including the Indian Ports Act, 2025, Coastal Shipping Act, 2025, and Modernised Merchant Shipping Legislation, 2025 — aimed at modernising port regulation, improving security oversight, and supporting trade efficiency.
Relevance
- GS-III: Internal Security & Infrastructure
- Port security architecture, cyber-maritime threats, anti-smuggling, trafficking control
- GS-II: Federalism & Regulation
- Centre–State powers, regulation of non-major ports, governance reforms
What is the Bureau of Port Security (BoPS) and what is its role?
- Institutional design
- Statutory body under the Ministry of Ports, Shipping & Waterways
- Modelled on the Bureau of Civil Aviation Security (BCAS)
- Legal mandate to enforce International Ship and Port Facility Security (ISPS) Code and global security standards
- Core functions
- Single-point regulatory oversight & coordination across ports and ships
- Standardised security audits, risk assessments, certification & compliance
- CISF designated as Recognised Security Organisation (RSO) → prepares security plans, trains private & State port agencies
- Graded security implementation across major and non-major ports
- Cyber & intelligence role
- Dedicated division for cybersecurity of port IT/OT systems
- Collection & exchange of security intelligence; coordination with national cyber agencies
- Scope of threat coverage
- Maritime terrorism, smuggling (arms/drugs), human trafficking, illegal migration, poaching, piracy
- Digital intrusions & cyber-sabotage in port operations
What challenges in coastal and port security does India face, and how will BoPS address them?
- Multi-agency fragmentation
- Roles split across Coast Guard, Navy, CISF, State Marine Police, Customs, Port Authorities → gaps in coordination
- Non-uniform standards
- Varied security protocols across major vs. non-major ports
- Rising maritime-crime footprint
- Increased drug & arms smuggling via sea routes, illegal migration, and grey-zone activities
- Cyber-vulnerability
- Growing digitisation of ports → exposure to ransomware, data breaches, navigation system tampering
- Trade scale-risk mismatch
- Rapid growth in cargo & port capacity outpacing legacy security frameworks
How BoPS mitigates these ?
- Unifies command & oversight → reduces duplication and response delays
- Standardises security architecture across all ports via CISF-led plans
- Integrates intelligence & cyber defence within port systems
- Ensures continuous compliance with ISPS & international benchmarks
- Creates nationwide port-security ecosystem supporting trade + safety together
Key Legislative Reforms (2025)
- Indian Ports Act, 2025 → replaces 1908 Act
- Modernises regulation, safety, environmental norms, port conservancy
- Aims to improve ease of doing business & sustainability
- Coastal Shipping Act, 2025
- Simplifies licensing, boosts domestic coastal trade & Indian-flagged vessels
- Modernised Merchant Shipping Legislation, 2025
- Aligns India with global maritime safety & operational standards
- BoPS Act / provisions (2025)
- Establishes statutory port-security regulator
Maritime Growth — Data Signals
- Cargo handled: ↑ from 974 MMT (2014) → 1,594 MMT (2025)
- Port capacity: ↑ 57% (last decade)
- Ship turnaround time: ↓ to ~48 hours (≈ global benchmarks)
- Coastal shipping volumes: ↑ 118%
- Inland waterways cargo: ↑ from 18.1 MMT (2014) → 145.5 MMT (2025) (≈ 8x rise)
- Global recognition: 9 Indian ports in World Bank Container Port Performance Index
What criticisms exist?
- Centralisation concerns
- Greater Union control over non-major (State-run) ports → termed a “silent cost to maritime federalism” by some States
- Procedural safeguards
- Powers of port, conservancy, and health officers for entry/inspection seen as broad, with unclear judicial guardrails
- Note: Critiques target the legislation & governance design, not the BoPS institution per se.
Keezhadi — Flood-Burial & OSL Dating Study
Why is it in news?
- A new study by researchers from the Physical Research Laboratory (PRL), Ahmedabad and the Tamil Nadu Department of Archaeology has used Optically Stimulated Luminescence (OSL) dating to determine when flood sediments buried parts of the Keezhadi settlement along the Vaigai river.
- The findings suggest that portions of the site were covered by flood-borne sediments roughly ~1,000 years ago, helping distinguish when people lived there from when nature buried the remains.
- The study was published in Current Science (October 25) and strengthens efforts to build a scientific timeline for the Keezhadi cultural landscape beyond literary references from the Sangam corpus.
Relevance
- GS-I: Indian Culture / Archaeology
- Urban settlement archaeology, Sangam-era material culture
- GS-I & GS-III: Geography–Environment Interface
- River dynamics, floods, settlement relocation, late-Holocene climate context
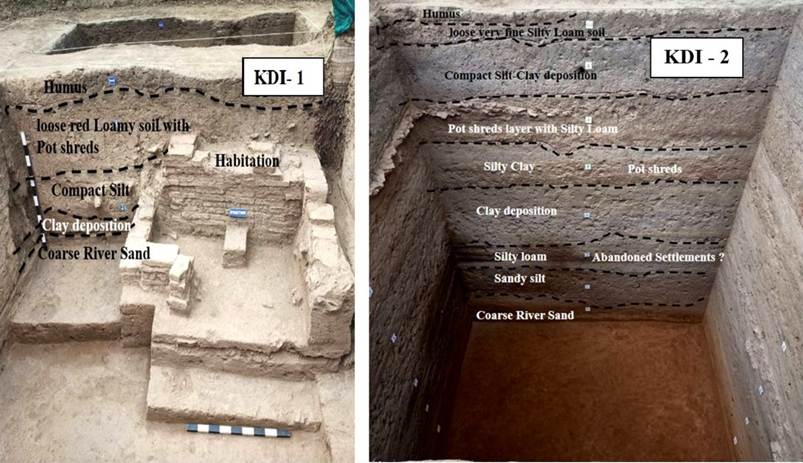
Facts & Data — Keezhadi Excavation Context
- Location: Keezhadi, Sivaganga district, Tamil Nadu — on the Vaigai floodplain.
- Excavations have revealed:
- Brick walls, channel-like drains, fine clay floors, pottery fragments
- Settlement layout suggesting urban planning, craft activity, and trade linkages
- Key research challenge:
- Sangam poems mention towns & trade, but lack precise chronology → archaeology + geoscience used to build timelines.
What did the new study examine?
- Focus: Sediment layers covering the archaeological structures, not the bricks themselves.
- Hypothesis: Flooding events of the Vaigai deposited sand–silt–clay layers that buried the settlement remains.
- Goal: Date when burial occurred → infer damage/abandonment phases of the settlement.
Method: Optically Stimulated Luminescence (OSL)
- Quartz grains accumulate energy from natural radiation while buried.
- Sunlight resets this clock when grains are exposed at the surface.
- In the lab, grains are stimulated with light → measured luminescence = time since last exposure → approximates time of burial.
- Study details:
- Four sediment samples from two pits (KDI-1, KDI-2)
- Samples extracted using light-tight metal tubes to prevent exposure.
Result: OSL dates indicate flood-deposit burial ~1,000 years ago (late Holocene phase).
Climate & River Dynamics
- The late Holocene climate in South India shows wet–dry fluctuations and river course shifts.
- The Vaigai today flows a few kilometres away from the mound → supports long-term channel migration.
- Implication: Floods + course shifts may have
- damaged infrastructure
- disrupted water access
- triggered abandonment or relocation of settlements.
Why the finding matters (Archaeological Significance)?
- Differentiates two timelines:
- Period of habitation vs. period of environmental burial
- Provides a process-based narrative: settlements respond to hydrological hazards, not only political decline.
- Guides future excavations: variable sediment thickness across pits suggests differential preservation of older layers.
Limits & Scope of Interpretation
- OSL dates the burial sediments, not the construction age of structures.
- Does not prove modern-type climate change → indicates long-term fluvial processes.
- Requires integration with ceramic typology, carbon dates, cultural layers, and stratigraphy.
ISRO LVM-3 — 6-tonne US Satellite Launch
Why is it in news?
- ISRO’s LVM-3 (Launch Vehicle Mark-3) successfully placed the 6,000-kg US communications satellite “BlueBird Block-2” into orbit — the heaviest foreign satellite ever launched by India.
- This was LVM-3’s third consecutive commercial mission under NewSpace India Ltd (NSIL), reinforcing India’s position in the global heavy-lift launch market and demonstrating reliability after its role in Chandrayaan-3.
Relevance
- GS-III: Science & Technology / Space Sector
- Heavy-lift capability, cryogenic tech, commercial launch ecosystem

Core Facts & Data
- Launch vehicle: LVM-3 (GSLV-Mk III) – India’s heavy-lift rocket
- Payload mass: ~6,000 kg (heaviest satellite launched by ISRO to date)
- Payload customer: U.S. AST SpaceMobile
- Orbit: Near-equatorial LEO for direct-to-mobile broadband constellation
- Mission profile:
- Satellite released ~21 km lower than target orbit → onboard propulsion to raise orbit
- Commercial arm involved: NSIL
- Earlier LVM-3 high-value missions:
- Chandrayaan-3 (2023)
- OneWeb constellation launches — 72 satellites placed in orbit across two missions
About LVM-3
- Class: Heavy-lift, 3-stage launcher
- Stage 1: Two S200 solid strap-on boosters
- Stage 2: L110 liquid core stage
- Stage 3: C25 cryogenic upper stage (LOX + LH₂)
- Lift capability
- GTO: ~4–5 tonnes
- LEO: 8–10 tonnes (mission-dependent)
- Designed as India’s workhorse for deep-space & heavy satellites
What makes this mission significant?
- Market Positioning
- Demonstrates India’s entry into the heavy-satellite launch segment, competing with
SpaceX Falcon-9, Ariane-5/6
- Demonstrates India’s entry into the heavy-satellite launch segment, competing with
- Cost-competitiveness advantage
- LVM-3 offers lower launch costs than Western providers → boosts commercial demand
- Technology credibility
- Repeated success = higher global customer confidence in ISRO/NSIL
- Strategic signalling
- Enhances India’s role in satellite broadband constellations & dual-use space markets
About the Payload — BlueBird Block-2
- Purpose: Direct-to-mobile satellite broadband connectivity (no ground towers needed)
- Use-cases
- Remote-area coverage, disaster communications, maritime connectivity
- Constellation vision: Global space-based mobile network (competes with Starlink variants)
India’s Commercial Launch Trajectory — Evidence
- ISRO commercial launches (last decade): ~45 missions
- Shift toward LEO broadband constellations — OneWeb + BlueBird
- NSIL contract portfolio expanding → growth in global launch services exports
Broader Strategic Relevance
- Space economy expansion → supports Make in India + export revenues
- Private–public ecosystem integration (NSIL, IN-SPACe, startups)
- Strengthens technological sovereignty in heavy-lift & cryogenic capability
- Supports ambitions in Gaganyaan crewed missions & deep-space exploration
Challenges & Next-Step Priorities
- Fleet cadence & capacity — increase launch frequency for competitiveness
- Reusability roadmap — RLV/Next-gen launchers to cut costs further
- Global competition pressure from SpaceX rideshare pricing
- Supply-chain deepening — domestic ecosystem for engines, avionics, composites
Only 1 in 4 marginal farmers in India linked to cooperatives, report finds
Why is it in news?
- The State of Marginal Farmers in India 2025 report by the Forum of Enterprises for Equitable Development (FEED) — released on Kisan Diwas (Dec 23, 2025) — finds that less than 25% of marginal farmers are active members of agricultural cooperatives, despite marginal farmers constituting ~60–70% of India’s agricultural households.
- The report assesses cooperative access and outcomes across six states — Andhra Pradesh, Bihar, Himachal Pradesh, Maharashtra, Tripura, and Uttarakhand — and highlights structural exclusion, digital divides, and gender gaps within the cooperative ecosystem.
Relevance
- GS-III: Agriculture, Inclusive Growth, Rural Institutions
- Role of PACS, credit access, service-hub model, livelihood outcomes
- GS-II: Social Justice / Participation Gaps
- Gender exclusion, digital divide, elite capture, governance capacity
Key Facts & Data — Who are marginal farmers?
- Definition: Own < 1 hectare of land.
- Share in agrarian structure: 60–70% of farm households; backbone of smallholder agriculture.
- Yet only ~1 in 4 are cooperative members — signalling weak institutional inclusion.
Role of Cooperatives & PACS — Why they matter ?
- Primary Agricultural Credit Societies (PACS) = lowest tier of the cooperative system; closest interface for rural households.
- Provide credit, input supply, procurement & marketing channels, and increasingly digital/public services (PDS, e-governance links).
- Function as rural service hubs in several states → linked to better livelihood outcomes.
What the report finds ? — Evidence from Six States
- Low participation especially in Bihar, Tripura, Himachal Pradesh.
- Barriers to inclusion
- Complex membership procedures & documentation
- Long distances to PACS and weak last-mile presence
- Limited working capital → low service reliability
- Persistent social exclusion (caste, class, gender)
- Consequences
- Higher dependence on informal credit/markets
- Slower income growth, higher vulnerability to climate & price shocks
Digital Divide — Facts
- Tripura: 77.8% cooperatives use no digital tools
- Bihar: 25% cooperatives report zero digital adoption
- Digital use largely informational, not transformational
- Women & older farmers face skill constraints, limiting benefits.
Gender & Leadership Gaps
- Women members registered: 21.25 lakh (2.125 million)
- Women directors on cooperative boards: 3,355 → very low leadership conversion
- Barriers: restrictive norms, mobility limits, unpaid care burden → decision-making remains male-dominated.
Where access exists — Impact is measurable ?
- Income outcomes
- 45% cooperative-linked marginal farmers report income increase
- ~21% report decline/stagnation
- Livelihood security
- 49% members report improved security; ~16% remain insecure
- Financial inclusion
- 67% members access credit/financial services via cooperatives
- Productivity
- 42% report improved crop yields; 22.5% report decline
- States with PACS as integrated service centres show stronger positive outcomes.
Why are marginal farmers excluded?
- Institutional design gaps: procedures, documentation, capital constraints
- Geographical inequity: uneven spread of PACS, long travel costs
- Social hierarchies: elite capture, weak voice for women & marginal groups
- Capability deficit: limited digital literacy, low management capacity
- Policy-practice gap: cooperative reforms focus on scale, not inclusion.
Policy Relevance
- Strengthen last-mile cooperative presence in low-coverage districts
- Simplify membership & governance norms; ensure grievance & transparency
- Capital infusion + professionalisation of PACS operations
- Targeted digital capacity-building, especially for women & elderly farmers
- Promote integrated PACS (credit + inputs + procurement + services) to maximise impact.
Large share of India’s PM2.5 not emitted directly, but chemically formed in the atmosphere: CREA Study
Why is it in news?
- A new analysis by the Centre for Research on Energy and Clean Air (CREA) finds that a large share of India’s PM2.5 pollution is not directly emitted, but is chemically formed in the atmosphere from precursor gases, especially sulphur dioxide (SO₂) from coal-based power plants.
- The study shows that up to 42% of India’s PM2.5 is secondary particulate matter, mainly ammonium sulphate, and warns that unless India targets SO₂ and other precursor emissions, air-quality gains under NCAP will remain limited and short-lived.
Relevance
- GS-III: Environment / Air-Pollution Governance
- Secondary PM2.5, SO₂ control, coal-power emissions, NCAP strategy gaps
- GS-III: Energy–Environment Trade-offs
- FGD policy, precursor-gas regulation, public-health externalities
Key Facts & Data — PM2.5 Composition in India
- Share of secondary PM2.5 (national): up to 42% — predominantly ammonium sulphate
- Primary precursor: SO₂ → reacts with ammonia & atmospheric oxidants → secondary sulphate aerosols
- India = world’s largest SO₂ emitter
- ~60% of national SO₂ emissions from coal-fired power plants
- FGD policy gap: ~78% of coal plants exempted from installing Flue Gas Desulphurisation (FGD) → weak SO₂ control at source
State-level Evidence (CREA assessment using NASA MERRA-2, 2024)
- Highest ammonium sulphate contribution
- Chhattisgarh — 42%
- Odisha — 41%
- Across states: ammonium sulphate = 17–42% of PM2.5 mass
- Most states cluster at 30–40% annually
- Seasonal profile (pan-India)
- Winter: 31–52% of PM2.5
- Post-monsoon: 27–53%
- Summer: 11–36%
- Monsoon: 4–26%
➝ Secondary PM remains significant year-round, and dominant in polluted months.
Delhi Case Study — What drives severe episodes?
- ~33% of Delhi’s annual PM2.5 = secondary ammonium sulphate
- Seasonal dominance:
- Post-monsoon: 49% of PM2.5
- Winter: 41%
- Summer/Monsoon: ~21%
- Episodes are driven largely by regional SO₂ plumes + secondary formation, not only local primary emissions.
What the findings imply ?
- PM2.5 challenge ≠ just road dust / primary emissions
- Secondary particulate matter is a core driver, not a marginal factor.
- Coal-power SO₂ controls are pivotal
- FGD exemptions undermine health & NCAP outcomes
- States with dense thermal clusters show highest secondary sulphate loads
- Policy–monitoring gap
- Current strategies emphasise PM10 & visible dust sources
- Chemical composition & precursor gases (SO₂, NO₂, NH₃) remain under-regulated.
CREA’s Policy Message (Evidence-linked)
- Reinstate mandatory FGD installation across all coal-based TPPs
- Integrate precursor-gas reduction targets in NCAP revision
- Expand speciated PM monitoring (sulphate, nitrate, ammonium) alongside mass concentration
- Coordinate regional emission controls during winter/post-monsoon high-risk periods.
What is Secondary PM2.5?
- Primary PM2.5: emitted directly (dust, combustion soot, vehicle exhaust)
- Secondary PM2.5: forms in the atmosphere when gaseous precursors react:
- SO₂ → sulphates (ammonium sulphate)
- NOx → nitrates
- NH₃ (agriculture, waste) → reacts with SO₂/NOx aerosols
- Secondary particles are finer, more toxic, and travel long distances → regional pollution episodes.


