Why is it in News?
- AidData (William & Mary University) released a major dataset (2000–2023) showing China lent over $2 trillion to 80%+ of the world, revealing a strategic shift from development lending to commercial lending.
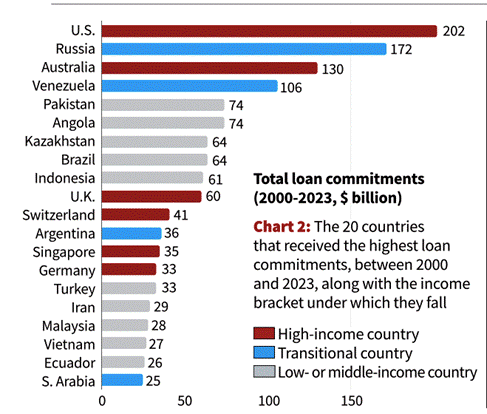
- Shows unexpected top beneficiaries: U.S. firms received ~$200 billion, making the U.S. the largest single-country beneficiary.
- Data indicates: BRI’s decline, shift to high-income economies, and greater opacity through offshore structures.
Relevance:
GS2 – International Relations
- China’s transformation from development lender → commercial financier.
- Rise of parallel financial architecture challenging WB–IMF dominance.
- Strategic leverage through corporate lending, tech acquisition, and supply-chain influence.
GS3 – Economy
- Global credit flows, debt sustainability, hidden debt risks.
- Impact on developing economies’ fiscal health and India’s external sector.

Basics: What is Chinese Global Lending?
- State-driven external finance system led by:
- China Development Bank
- Export–Import Bank of China
- State-owned enterprises
- People’s Bank of China
- Two broad categories:
- Official Development Assistance (ODA) → concessional, development-oriented.
- Other Official Flows (OOF) → commercial, market-rate, strategic.
Key Data & Trends (2000–2023)
Scale
- Total global lending/grants: >$2 trillion.
- Recipients: 179 of 217 countries/territories.
- 2023 lending alone: $140 billion → makes China the world’s largest creditor.
Top beneficiaries (country entities)
- U.S. companies: ~$200 billion (2,500 projects; 95% from Chinese state-owned institutions).
- Russia: $172 billion.
- Australia: $130 billion.
- EU (27 states): $161 billion.
Shift in beneficiary profile
- High-income countries received $943 billion → ~20%+ of total Chinese lending.
- Only 25% of 2023 portfolio is now BRI-linked, down from 75% earlier.
Decline in aid
- Typical annual China ODA: ~$5.7 billion.
- 2023 ODA plunged to $1.9 billion.
Sectoral pattern
- Earlier: Infrastructure → energy, transport, connectivity.
- Now: Commercial finance → mergers, acquisitions, corporate lending.
Structural Shift: From Aid Provider to Commercial Financier
Earlier Model (2000–2015)
- Focus on:
- Low-income nations
- BRI infrastructure
- Strategic influence + resource access
- Concessional loans, long maturity, tied procurement.
Current Model (2016–2023)
- Pivot to high-income economies for:
- Access to advanced technologies
- Financial returns
- Corporate stakes
- U.S. lending surged from $320 million (2000) → $19 billion (2023).
- 75% of U.S. transactions are commercial; only 7% developmental.
Methods & Concerns Raised by AidData
- 80% success rate in overseas M&A approvals due to:
- Weak foreign investment screening in recipient countries.
- Opaque mechanisms:
- Use of offshore shell companies.
- Syndicated international banks.
- Complex creditor structures reducing transparency.
- Rising risk of hidden debt in low-income countries.
Implications for Global Finance & Geopolitics
For Global Financial Architecture
- China emerging as:
- Largest official creditor, surpassing World Bank + IMF individually.
- Parallel financial ecosystem → reduces Western institutional dominance.
For Developed Economies
- China’s commercial lending → deeper corporate penetration.
- Strategic concerns around:
- Technology acquisition
- Supply chain leverage
- National security vulnerabilities
For Developing Countries
- Decline in aid → widening financing gap for:
- Infrastructure
- Social development
- Increased exposure to:
- Debt distress
- Collateral-backed lending (ports, minerals)
For BRI
- Downscaling but not disappearing.
- Prioritisation of:
- Quality over quantity
- Higher-return projects
- Geopolitical essentials
India Angle
- Total Indian borrowing/aid from China (2000–2023): $11.1 billion.
- Sectors:
- Energy
- Banking & financial services
- Nature: Mix of commercial + developmental.
- India remains cautious due to:
- Strategic competition
- Supply chain dependencies
- Security concerns (FDI scrutiny after 2020)


