CONTENTS
- Snow Absence in Kashmir and Ladakh This Winter: Implications and Causes
- Green Hydrogen: Enabling Measures Roadmap for Adoption in India
- Positive Trends in Multidimensional Poverty Reduction in India
- Himalayan Wolf
- Swachh Survekshan Awards 2023
- Cultural Continuity in Vadnagar, Gujarat: A Challenge to the “Dark Age” Notion
- Windfall tax
Snow Absence in Kashmir and Ladakh This Winter: Implications and Causes
Context:
One of Kashmir’s main winter tourism attractions, Gulmarg, has been bereft of snow this season. This has led to a plunge in the flow of tourists and severely hitting the business of ski resorts.
Relevance:
GS I: Geography
Dimensions of the Article:
- Dry Winter in Jammu & Kashmir: Causes and Implications
- Impacts of Dry Winter
- Normal Climatic Conditions: The Pacific Ocean Influence
- El Nino and La Nina
Dry Winter in Jammu & Kashmir: Causes and Implications
Existing Pattern:
- Traditionally, Jammu and Kashmir, including Ladakh, experience winter precipitation in the form of snowfall.
- Normal snowfall patterns include the first snowfall in the first half of December continuing through most of January.
Rainfall Deficit:
- Unusual dry conditions observed this winter, with no significant rains or snowfall.
- Jammu and Kashmir witnessed an 80% rainfall deficit in December and a 100% deficit (no rain) in January.
Reasons behind the Dry Winter:
- Decreasing snowfall trend attributed to a decline in western disturbance events and rising temperatures, indicative of climate change.
- The prevailing El Niño event in the eastern Pacific Ocean considered an additional factor influencing this year’s conditions.
- Western disturbances, crucial for winter precipitation, have been decreasing, with only a few feeble events this season.
Rising Temperatures:
- Increasing temperatures, especially in upper elevation areas, contribute to the decline in snowfall.
- Srinagar temperatures sometimes comparable to or even higher than Delhi, affecting the region’s winter climate.
El Niño Impact:
- Persisting El Niño has disrupted global atmospheric circulation, potentially contributing to the precipitation deficit in the region.
Impacts of Dry Winter:
Long-term Implications:
- Reduced hydroelectricity generation due to less snowfall.
- Increased rate of glacier melting.
- Adverse effects on drinking water supply with scanty snowfall leading to minimal groundwater recharge.
Short-term Implications:
- Higher risk of forest fires, agricultural drought, and reduced crop production during a dry spell.
- Early spring onset can negatively impact crop yields, especially for winter crops like horticulture.
- Critical for the local economy, a lack of snowfall affects yields of apples and saffron, impacting livelihoods.
Normal Climatic Conditions: The Pacific Ocean Influence
Ocean Temperature and Weather:
- Weather patterns are significantly influenced by ocean temperatures, where warmer oceans lead to increased cloud formation and rainfall.
- The Pacific Ocean, especially near the equator, experiences elevated temperatures due to the Sun.
Normal Atmospheric Circulation:
- Under typical conditions, a low-pressure system forms in northern Australia and Indonesia, while a high-pressure system develops off the coast of Peru.
- This results in strong trade winds blowing from east to west over the Pacific, transporting warm surface waters westward.
- Convective storms, including thunderstorms, are common over Indonesia and coastal Australia.
El Nino and La Nina
Frequency and Duration:
- El Nino and La Nina are opposing climate trends, deviating from normal conditions and lasting nine to twelve months, with potential extensions.
- These events occur irregularly, every two to seven years on average, with El Nino being more frequent than La Nina.
- Collectively referred to as the El Nino-Southern Oscillation (ENSO) cycle by scientists.
El Nino – Warm Phase:
- El Nino is characterized by a band of warmer water spreading from west to east in the equatorial Pacific Ocean.
- The warm phase disrupts normal atmospheric patterns, impacting global weather, ecosystems, and economics.
La Nina – Cold Phase:
- La Nina involves a band of cooler water spreading east-west in the equatorial Pacific Ocean.
- The cold phase also influences global weather, ecosystems, and economic factors, but in contrasting ways to El Nino.
Global Effects:
- Both El Nino and La Nina have far-reaching effects on weather patterns, wildfires, ecosystems, and economies worldwide.
- These climate phenomena play a crucial role in shaping the variability and unpredictability of weather events on a global scale.
-Source: Indian Express
Green Hydrogen: Enabling Measures Roadmap for Adoption in India
Context:
Recently, the World Economic Forum along with Bain & Company has released a report titled- Green Hydrogen: Enabling Measures Roadmap for Adoption in India, highlighting that Green Hydrogen production cost needs to be reduced to less than or equal to USD 2 per kg.
Relevance
GS III: Environment and Ecology
Dimensions of the Article:
- Key Highlights of the Report on India’s Energy Landscape and Green Hydrogen Mission
- What is Green hydrogen?
Key Highlights of the Report on India’s Energy Landscape and Green Hydrogen Mission
Energy Landscape and Demand Projection:
- India ranks as the third-largest global economy in terms of energy requirements.
- Energy demand is expected to surge by 35% by 2030.
- In 2022, India’s energy import bill reached USD 185 billion.
Commitment to Net Zero and COP26:
- India pledged to achieve Net Zero by 2070 at COP26 in 2021.
- Green Hydrogen is identified as crucial for meeting energy security needs and reducing emissions in hard-to-abate sectors.
National Green Hydrogen Mission (NGHM):
- Launched by the Indian government in 2022.
- Aims to boost green hydrogen production and consumption with approximately USD 2.3 billion in incentive funding (2022-2030).
Current Hydrogen Production Scenario:
- India presently produces 6.5 MMTPA of hydrogen, mainly for crude-oil refineries and fertilizer production.
- Majority of hydrogen supply is Gray Hydrogen, produced with fossil fuels, contributing to CO2 emissions.
Renewable Energy Potential and Capacity Expansion:
- Green Hydrogen production necessitates a substantial supply of renewable energy for electrolysis.
- India’s renewable energy potential can support green hydrogen growth, but rapid capacity addition is required for both green hydrogen and overall electricity needs.
Limited Traction and Anticipated Growth:
- Limited on-the-ground traction for green hydrogen, with most stakeholders adopting a “wait-and-watch” approach.
- Expectations point to significant green hydrogen production beginning in 2027 and beyond.
Constraints on Expansion:
- Supply-side constraints include the cost of production and delivery.
- Demand-side constraints involve the readiness of Indian players to integrate green hydrogen into traditional industrial processes.
What is Green hydrogen?
- A colourless, odourless, tasteless, non-toxic and highly combustible gaseous substance, hydrogen is the lightest, simplest and most abundant member of the family of chemical elements in the universe.
- But a colour — green — prefixed to it makes hydrogen the “fuel of the future”.
- The ‘green’ depends on how the electricity is generated to obtain the hydrogen, which does not emit greenhouse gas when burned.
- Green hydrogen is produced through electrolysis using renewable sources of energy such as solar, wind or hydel power.
- Hydrogen can be ‘grey’ and ‘blue’ too.
- Grey hydrogen is generated through fossil fuels such as coal and gas and currently accounts for 95% of the total production in South Asia.
- Blue hydrogen, too, is produced using electricity generated by burning fossil fuels but with technologies to prevent the carbon released in the process from entering the atmosphere.
Green Hydrogen Importance
- Hydrogen is being used across the United States, Russia, China, France and Germany. Countries like Japan desire to become a hydrogen economy in future.
- Green hydrogen can in future be used for
- Electricity and drinking water generation, energy storage, transportation etc.
- Green hydrogen can be used to provide water to the crew members in space stations.
- Energy storage- Compressed hydrogen tanks can store the energy longer and are easier to handle than lithium-ion batteries as they are lighter.
- Transport and mobility- Hydrogen can be used in heavy transport, aviation and maritime transport.
India’s Initiatives to Promote Green Hydrogen
National Green Hydrogen Mission:
- The launch of the National Green Hydrogen Mission aims to significantly boost green hydrogen production in India.
- The mission targets the annual production of 5 million metric tonnes of green hydrogen by 2030.
- This initiative is closely aligned with India’s plan to establish approximately 125 gigawatts of renewable energy capacity.
- The program provides financial incentives to support domestic production of electrolysers and green hydrogen.
- These incentives intend to accelerate the adoption of green hydrogen technology, foster technological advancements, and drive down production costs.
Green Hydrogen Consumption Obligations:
- The Ministry of New and Renewable Energy (MNRE) has proposed the introduction of green hydrogen consumption obligations.
- Similar to the renewable purchase obligations for electricity distribution companies, these obligations will apply to the fertilizer and petroleum refining sectors.
- These industries will be required to incorporate a certain percentage of green hydrogen in their overall hydrogen consumption.
- This measure aims to drive the adoption of green hydrogen across key sectors, further contributing to India’s transition to cleaner energy sources.
-Source: The Hindu
Positive Trends in Multidimensional Poverty Reduction in India
Context:
The NITI Aayog’s recent Discussion Paper, “Multidimensional Poverty in India since 2005-06,” reveals encouraging progress, with 24.82 crore people escaping multidimensional poverty over the past nine years. The paper draws on data from the National Family Health Surveys (NFHS) conducted in 2005-06, 2015-16, and 2019-21 to analyze the long-term trends in poverty.
Relevance:
GS III: Indian Economy
Dimensions of the Article:
- National Multidimensional Poverty Index (MPI)
- Key Highlights of the Multidimensional Poverty Index in India Since 2005-2006
- NITI Aayog
National Multidimensional Poverty Index (MPI)
Dimensions and Indicators:
- Measures deprivations across three equally weighted dimensions: Health, Education, and Standard of Living.
- Represented by 12 Sustainable Development Goals-aligned indicators.
Inclusive Indicators:
- Indicators include Nutrition, Child and Adolescent mortality, Maternal Health, Years of schooling, School Attendance, Cooking fuel, Sanitation, Drinking water, Electricity, Housing, Assets, and Bank Accounts.
Global Methodology:
- MPI utilizes the robust Alkire and Foster (AF) method on a global scale.
- Identifies poverty based on universally acknowledged metrics, providing a comprehensive view beyond conventional monetary poverty measures.
Key Highlights of the Multidimensional Poverty Index in India Since 2005-2006
Significant Reduction in Multidimensional Poverty:
- India witnessed a substantial decrease in multidimensional poverty from 29.17% in 2013-14 to 11.28% in 2022-23, marking a decline of 17.89 percentage points.
- Approximately 24.82 crore people escaped multidimensional poverty in the last nine years, credited to government initiatives.
State-wise Progress:
- Uttar Pradesh, Bihar, Madhya Pradesh, and Rajasthan experienced the sharpest decline in the number of people classified as poor according to the MPI.
- Uttar Pradesh led with 5.94 crore people escaping multidimensional poverty, followed by Bihar, Madhya Pradesh, and Rajasthan.
Improvement in All 12 MPI Indicators:
- All 12 indicators of the MPI exhibited significant improvement, reflecting progress in Health, Education, and Standard of Living dimensions.
Severity of Deprivation (SoD) Trends:
- SoD declined at a slightly lower rate between 2015-16 and 2019-21 compared to 2005-06 and 2013-14.
- Reduction in the share of MPI poor out of the total population accelerated after 2015-16, indicating faster progress.
Progress Towards SDG Target 1.2:
- India is on track to achieve SDG Target 1.2 well before 2030.
- Indicators related to the standard of living dimension showed significant improvements, including reduced deprivation in cooking fuel, sanitation facilities, and access to bank accounts.
Impact of Government Initiatives:
- Initiatives like Poshan Abhiyan and Anemia Mukt Bharat have improved healthcare access, leading to decreased deprivation.
- Flagship programs, such as Pradhan Mantri Garib Kalyan Anna Yojana, PM Jan Dhan Yojana, and PM Awas Yojana, have contributed to financial inclusion and safe housing for the underprivileged.
Comprehensive Government Programs:
- Food Security programs like the Targeted Public Distribution System cover 81.35 crore beneficiaries.
- Decisions like extending free food grain distribution under Pradhan Mantri Garib Kalyan Anna Yojana for five more years showcase the government’s commitment.
- Various campaigns, including Swachh Bharat Mission and Jal Jeevan Mission, have collectively elevated living conditions and well-being.
NITI Aayog
Establishment and Purpose:
- NITI Aayog, established on January 1, 2015, replaced the Planning Commission.
- Emphasis on a ‘Bottom-Up’ approach, reflecting the vision of “Maximum Governance, Minimum Government” and promoting ‘Cooperative Federalism.’
Team India Hub:
- Serves as an interface facilitating collaboration between States and the Centre.
- Aims to foster cooperation and coordination in the planning and execution of policies and programs.
Knowledge and Innovation Hub:
- Focuses on enhancing the think-tank capabilities of NITI Aayog.
- Engages in research, innovation, and knowledge creation to inform policy formulation and decision-making.
-Source: The Hindu
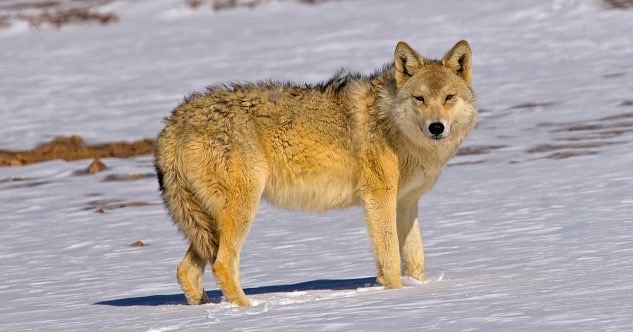
Himalayan Wolf
Context:
The Himalayan Wolf (Canis lupus chanco), a prominent lupine predator found across the Himalayas has been assessed for the first time in the International Union for Conservation of Nature (IUCN)’s Red List.
Relevance:
GS III: Environment and Ecology
Dimensions of the Article:
- Key Facts About the Himalayan Wolf
- About the IUCN Red List
- Factors Contributing to the Decline of Himalayan Wolf Population
- Measures to Protect Himalayan Wolves
Key Facts About the Himalayan Wolf:
Habitat and Distribution:
- Inhabits the high elevations of the Himalayas in China, Nepal, India, and Bhutan.
- Typically found in alpine meadows and grasslands at elevations ranging from 10,000 to 18,000 feet.
Genetic Characteristics:
- Distinctive genetic markers; mitochondrial DNA suggests a genetic foundation predating the Holarctic grey wolf.
Behavior and Diet:
- Travels in small packs.
- Hunts wild sheep and goats, and occasionally preys on marmots, hares, and birds.
Population Status:
- Estimated population of 2,275-3,792 mature individuals.
- Mainly concentrated in a subpopulation across the Himalayan range of Nepal, India, and the Tibetan Plateau.
- Indian section hosts 227-378 mature individuals, primarily in Ladakh and Spiti Valley.
Conservation Status:
- IUCN Status: Vulnerable.
- Protected under the Wildlife Protection Act, 1972, under Schedule I.
About the IUCN Red List:
Purpose and Significance:
- Global resource for assessing the risk of extinction among animals, fungi, and plant species.
- Crucial indicator of global biodiversity health, offering insights into species’ characteristics, threats, and conservation measures.
Red List Categories:
- Defines the extinction risk with categories ranging from NE (Not Evaluated) to EX (Extinct).
- Critically Endangered (CR), Endangered (EN), and Vulnerable (VU) indicate species threatened with extinction.
Role in Conservation and Development Goals:
- Key indicator for Sustainable Development Goals and Aichi Targets.
IUCN Green Status of Species:
- Assesses the recovery of species’ populations and measures conservation success.
- Eight Green Status Categories, including Extinct in the Wild, Critically Depleted, Fully Recovered, etc.
Conservation Impact Assessment:
- Green Status assessment examines how conservation actions have influenced the current Red List status.
Factors Contributing to the Decline of Himalayan Wolf Population:
Habitat Degradation:
- Ongoing reduction in the area, extent, and quality of habitat.
Depredation Conflict:
- Seasonal or permanent high livestock abundance in wolf habitats triggers conflicts.
- Negative attitudes towards wolf conservation and retaliatory killing arise due to these conflicts.
Interbreeding with Domestic Dogs:
- Increasing problem in Ladakh and Spiti due to interbreeding.
- More feral dogs in these areas contribute to hybridization.
- Competition for resources, such as territory and prey, intensifies between wolves and wolf-dog hybrids.
Illegal Hunting:
- Wolves are hunted for trade in fur and body parts, including paws, tongues, heads, and other body parts.
- Hunting is not legal in all range states but remains a threat.
Measures to Protect Himalayan Wolves:
Habitat Conservation:
- Secure and restore healthy wild prey populations and landscapes.
- Establish wildlife habitat refuges.
Livestock Protection:
- Improve livestock guarding methods, including predator-proof corral pens.
- Implement sustainable livestock herding practices, such as reduced livestock loads and adapted herding.
Management of Feral Dogs:
- Manage populations of feral dogs to preserve ecological balance in wolf habitats.
Transboundary Cooperation:
- Emphasize the interconnectedness of wolf populations across borders.
- Implement coordinated research and monitoring initiatives to ensure unimpeded movement and safeguard natural behaviors.
-Source: Down To Earth
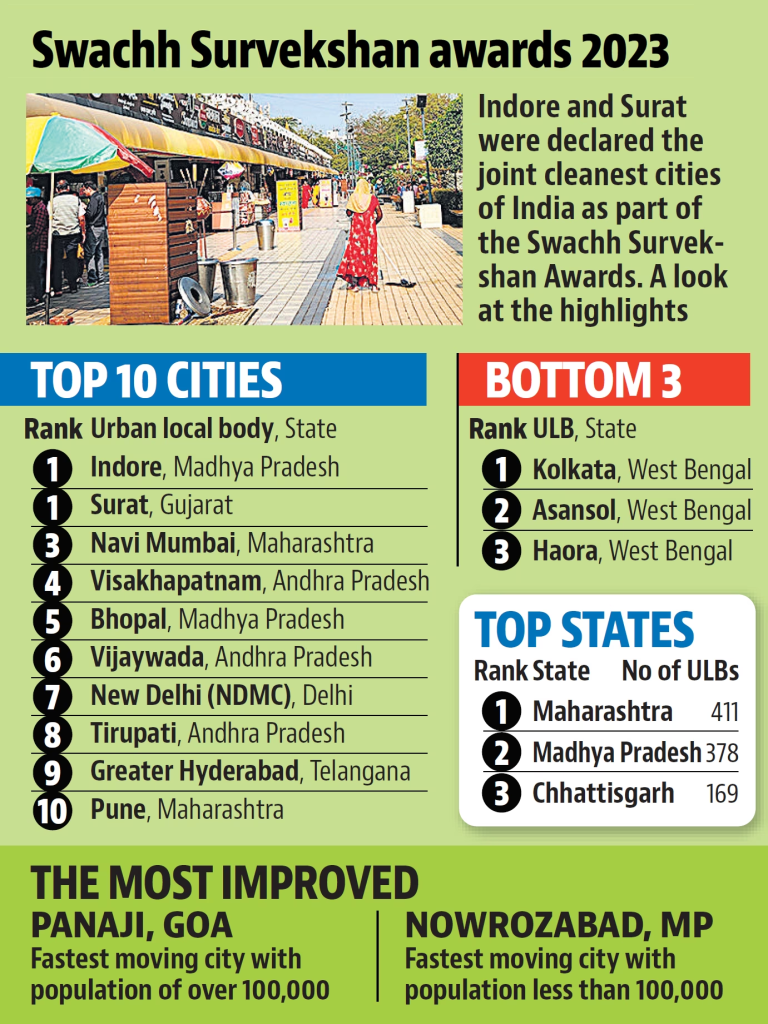
Swachh Survekshan Awards 2023
Context:
The Swachh Survekshan Awards 2023 ceremony, hosted by the Ministry of Housing and Urban Affairs (MoHUA) at Bharat Mandapam, New Delhi, witnessed the President of India presenting accolades for urban cleanliness. Indore and Surat jointly earned the cleanest city title, marking a significant achievement in sanitation efforts. Maharashtra claimed the top spot among states, highlighting its commitment to maintaining cleanliness in urban areas.
Relevance:
GS II: Government policies and Interventions
Dimensions of the Article:
- Survekshan Overview
- Major Highlights of Swachh Survekshan Awards 2023
Survekshan Overview:
- Conducted by the Ministry of Housing and Urban Affairs (MoHUA) since 2016.
- World’s largest urban sanitation and cleanliness survey.
- Encourages healthy competition among towns and cities to enhance service delivery and cleanliness.
Major Highlights of Swachh Survekshan Awards 2023:
Participation and Coverage:
- Survey covered 4,416 urban local bodies, 61 cantonments, and 88 Ganga towns.
- Reflects an increasing number of participating cities each year.
City Rankings:
- Indore retained the cleanest city title for the 7th consecutive year.
- Surat claimed the top spot, marking the first instance of two cities sharing the top prize since 2016.
- Both cities achieved 100% door-to-door waste collection, 98% source segregation, and 100% remediation of dumpsites.
- Navi Mumbai secured the third cleanest city position.
Evaluation Parameters:
- Factors considered in rankings included door-to-door waste collection, source segregation, cleanliness of public areas, clean water bodies, and citizens’ feedback on city cleanliness.
Cleanest State Award:
- Maharashtra received the cleanest state award.
- Achieved 89.24% door-to-door waste collection and 67.76% source segregation.
- Madhya Pradesh secured the second position in state cleanliness rankings.
Bottom Five States:
- Arunachal Pradesh, Mizoram, Rajasthan, Nagaland, and Tripura ranked as the bottom five states in terms of cleanliness.
Specialized Awards:
- Chandigarh received the Safaimitra Surakshit Shehar award for the best safety standards for sanitation workers.
- Varanasi recognized as the cleanest Ganga town.
- Sasvad in Maharashtra earned the cleanest city title among those with a population below 1 lakh.
- Mhow Cantonment declared the cleanest cantonment in the country.
-Source: The Hindu
Cultural Continuity in Vadnagar, Gujarat: A Challenge to the “Dark Age” Notion
Context:
A collaborative study conducted by the Indian Institute of Technology (Kharagpur) and the Archaeological Survey of India (ASI) has revealed compelling evidence of cultural continuity in Vadnagar, Gujarat, even after the collapse of the Harappan civilization. This finding challenges the traditional concept of a “Dark Age” by showcasing that Vadnagar maintained cultural resilience and continuity beyond the Harappan collapse, providing valuable insights into the region’s historical trajectory.
Relevance:
GS I: History
Dimensions of the Article:
- Excavation at Vadnagar: Uncovering Millennia of History
- Archaeological Survey of India (ASI): Preserving Cultural Heritage
Excavation at Vadnagar: Uncovering Millennia of History
Settlement Dating Back to 800 BCE:
- Evidence reveals a human settlement in Vadnagar dating back to 800 BCE.
- Places Vadnagar in the late-Vedic/pre-Buddhist Mahajanapadas or oligarchic republics period.
Climatic Influences and Historical Shifts:
- Rise and fall of kingdoms over 3,000 years, influenced by recurrent Central Asian invasions.
- Suggested links to severe climate changes, including variations in rainfall or droughts.
Multicultural Influences in Vadnagar:
- Described as a multicultural and multireligious settlement with influences from Buddhism, Hinduism, Jainism, and Islam.
Seven Cultural Stages Uncovered:
- Excavation revealed seven cultural stages, spanning Mauryan, Indo-Greek, Indo-Scythian, Hindu-Solankis, Sultanate-Mughal, and Gaekwad-British colonial rule up to the present day.
Archaeological Artifacts and Discoveries:
- Various artifacts discovered, including pottery, copper, gold, silver, and iron objects.
- Notable findings include intricately designed bangles and coin molds from the Indo-Greek rule.
- One of the oldest Buddhist monasteries discovered, enriching the historical and cultural significance of Vadnagar.
Radiocarbon Dates Challenging “Dark Age” Notion:
- Unpublished radiocarbon dates suggest Vadnagar could be as old as 1400 BCE.
- Challenges the concept of a “Dark Age” between the collapse of the Indus Valley Civilization and the emergence of the Iron Age.
Archaeological Survey of India (ASI): Preserving Cultural Heritage
Premier Organization for Archaeological Research:
- ASI, under the Ministry of Culture, is the leading organization for archaeological research and protection of the nation’s cultural heritage.
Maintenance of Ancient Monuments:
- Prime concern includes maintaining ancient monuments, archaeological sites, and remains of national importance.
Regulation of Archaeological Activities:
- Regulates all archaeological activities in the country as per the provisions of the Ancient Monuments and Archaeological Sites and Remains Act, 1958.
- Also regulates the Antiquities and Art Treasure Act, 1972.
Founding and Director-General:
- Founded in 1861 by Alexander Cunningham, known as the “Father of Indian Archaeology.”
- Alexander Cunningham served as the first Director-General of ASI.
-Source: The Hindu
Windfall Tax
Context:
India cut its windfall tax on petroleum crude to 1,700 rupees ($20.53) a tonne from 2,300 rupees a tonne, according to a recent government notification.
Relevance:
GS III: Indian Economy
Dimensions of the Article:
- What is a windfall tax?
- Why are countries levying windfall taxes now?
- What are the issues with imposing such taxes?
What is a windfall tax?
- Windfall taxes are designed to tax the profits a company derives from an external, sometimes unprecedented event — for instance, the energy price-rise as a result of the Russia-Ukraine conflict.
- These are profits that cannot be attributed to something the firm actively did, like an investment strategy or an expansion of business.
- The U.S. Congressional Research Service (CRS) defines a windfall as an “unearned, unanticipated gain in income through no additional effort or expense”.
- Governments typically levy this as a one-off tax retrospectively over and above the normal rates of tax.
- One area where such taxes have routinely been discussed is oil markets, where price fluctuation leads to volatile or erratic profits for the industry.
- There have been varying rationales for governments worldwide to introduce windfall taxes, from redistribution of unexpected gains when high prices benefit producers at the expense of consumers, to funding social welfare schemes, and as a supplementary revenue stream for the government.
Why are countries levying windfall taxes now?
- Prices of oil, gas, and coal have seen sharp increases since last year and in the first two quarters of the current year, although they have reduced recently.
- Pandemic recovery and supply issues resulting from the Russia-Ukraine conflict shored up energy demands, which in turn have driven up global prices.
- The rising prices meant huge and record profits for energy companies while resulting in hefty gas and electricity bills for households in major and smaller economies. Since the gains stemmed partly from external change, multiple analysts have called them windfall profits.
What are the issues with imposing such taxes?
Brew uncertainty in the market about future taxes:
- Analysts say that companies are confident in investing in a sector if there is certainty and stability in a tax regime. Since windfall taxes are imposed retrospectively and are often influenced by unexpected events, they can brew uncertainty in the market about future taxes.
IMF’s Advice Note:
- The International Monetary Fund (IMF), which released an advice note on how windfall taxes need to be levied also said that taxes in response to price surges may suffer from design problems—given their expedient and political nature.
- It added that “introducing a temporary windfall profit tax reduces future investment because prospective investors will internalise the likelihood of potential taxes when making investment decisions”.
CRS report:
- There is another argument about what exactly constitutes true windfall profits; how can it be determined and what level of profit is normal or excessive.
- A CRS report, for instance, argues that if rapid increases in prices lead to higher profits, in one sense it can be called true windfalls as they are unforeseeable but on the other hand, companies may argue that it is the profit they earned as a reward for the industry’s risk-taking to provide the end user with the petroleum product.
Another issue is who should be taxed:
- Only the big companies responsible for the bulk of high-priced sales or smaller companies as well— raising the question of whether producers with revenues or profits below a certain threshold should be exempt.
-Source: Business Standards


