Contents
- Breathing fresh air into the NCR’s pollution control
- Should the state stop focusing on population control?
Breathing fresh air into the NCR’s pollution control
Context:
- Chief Justice of India asked the Government as a ‘layman’ the question that haunts the Capital, that is, why does pollution continue to smother Delhi despite orders from Supreme Court, action from Government and lawyers arguing so much.
- The court gave the Government 24 hours to find a way or make way for the Supreme Court to act.
- The National Green Tribunal (NGT) had begun the process of taking a new look at the menace of air pollution in Delhi-NCR by asking the Government to list its causes.
Relevance:
GS-III: Environment and Ecology (Environmental Pollution, Pollution Control Measures, Conservation of Environment and Ecology), GS-II: Governance (Government Policies and Interventions)
Dimensions of the Article:
- India’s Air Pollution Crisis put into perspective
- About the changes in Delhi’s Air quality
- Causes of air pollution in Delhi and Adjoining regions
- Measures to control Air Pollution in Delhi and adjoining regions
- Lessons from Beijing
India’s Air Pollution Crisis put into perspective
- India has 37 of the world’s 50 most polluted cities, despite its air quality standards being laxer.
- India’s standards for PM2.5 and PM10 are 60 and 100 µg/m3 respectively (over 24 hours), while the WHO’s new standards are 15 and 45 µg/m3 (over 24 hours).
- India’s air pollution-influenced mortality rates are among the worst – the Global Burden of Disease estimates that India lost 1.67 million lives (Uttar Pradesh had the biggest share followed by Maharashtra and Rajasthan) in 2019 directly as a result of breathing polluted air, or because of pre-existing conditions exacerbated by air pollution.
- The average life expectancy in Delhi is 6.4 years lower than the national average of 69.4, and the number is starting to fall for even coastal cities like Mumbai and Chennai.
The Serious threats
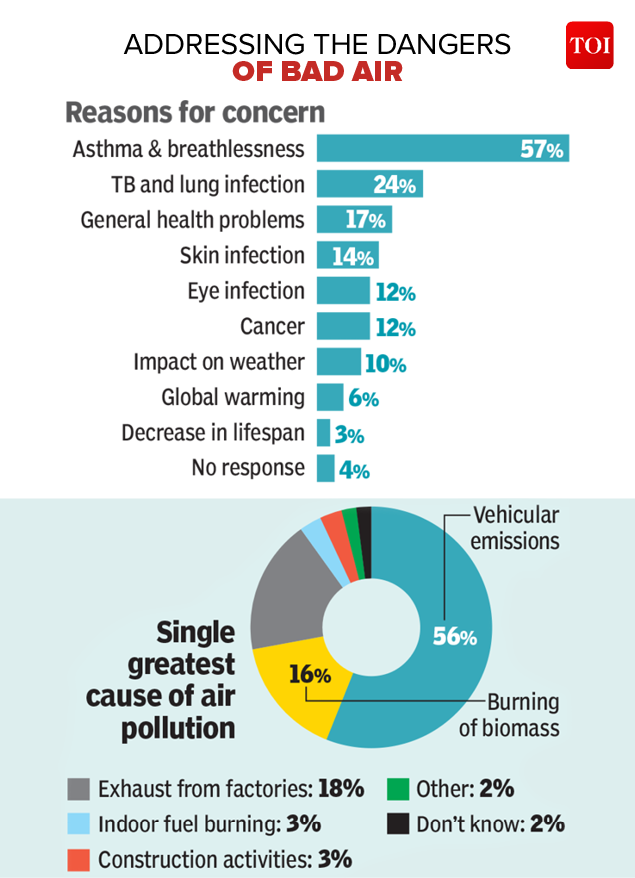
- The health impacts of PM2.5 exposure now include lung cancer, cerebrovascular disease, ischaemic heart disease and acute lower respiratory illness, besides exacerbating ailments like depression.
- Exposure to ozone has been linked to chronic obstructive pulmonary disease (COPD).
- Prolonged exposure to air pollutants affects newborns and babies still in the womb.
- Simply put, air pollution is a threat to generations even before they are born.
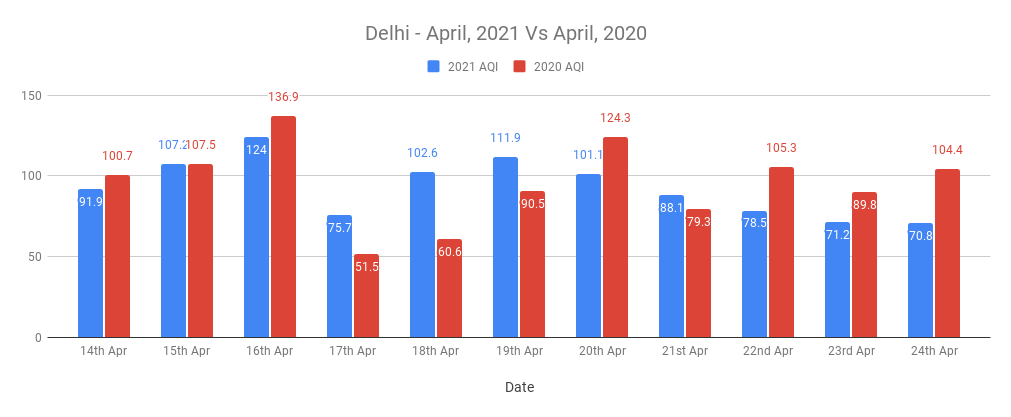
About the changes in Delhi’s Air quality
- Delhi’s air typically worsens in October-November and improves by March-April every year due to weather amongst other reasons.
- Current weather conditions are not unfavourable, unlike in winter. Hence, apart from local emissions, the deterioration in air quality is being attributed to an increase in fire counts, mostly due to burning of wheat crop stubble in northern India.
- Fires were also spotted Lahore, Gujranwala and Hafizabad in Pakistan which can contribute to deterioration of air quality.
- Deteriorating air quality is worrying amid an increasing number of novel coronavirus disease (COVID-19) and deaths. Medical experts have, from time to time, raised concerns about how high pollution levels can worsen the situation and aggravate respiratory conditions of the public.
- According to a report by CPCB, an increase of 258% to 335% has been observed in the concentration of PM10 in Delhi since 2009.
- Delhi was the most polluted capital city in the world in 2020 for the third consecutive year, according to a report by a Swiss group (released in March 2021) that ranked cities based on their air quality measured in terms of the levels of ultrafine particulate matter (PM 2.5).
Causes of air pollution in Delhi and Adjoining regions
- Increasing population and related developmental activities at the cost of environmental damage.
- The development of the region has largely been unplanned and often, industrial units that spew harmful chemicals into the atmosphere are located in residential and commercial areas and not designated areas.
- Increased vehicular traffic (which has not come down despite the Delhi metro) and the consequent rise in air and noise pollution.
- Almost 8,000 m tonnes of solid waste is being generated in Delhi (National Environmental Engineering Research Institute) every day, however, the authorities manage to clear only about 5000 – 5500 m tonnes of waste daily. This adds to the garbage piling up. This is not counting the hazardous and non-hazardous waste from industries.
- There is a rather high dependence on fossil fuels, whose burning causes a lot of emission of harmful gases into the atmosphere.
- Large scale construction activities lead to increased dust pollution, which leads to around 56% of PM10 and the PM2.5 load.
- The landlocked geography of Delhi also causes more air pollution as compared to other cities. The north-westerly winds coming from Rajasthan, sometimes Pakistan and Afghanistan bring in the dust to the region. The Himalayas obstruct the escape route of the air. This causes the dust and pollutants to settle in the region. This is more prominent during the winters because of low-level inversion (upward movement of air from the layers below is stopped). It is because of this landlocked geography of Delhi that it faces greater pollution when compared to the coastal city of Chennai (where despite high automobile population, has the sea breeze which provides an effective entry and exit for dispersing pollutants).
- Stubble burning also contributes to the air pollution in the region. During the winter months, the large scale stubble burning practised in Punjab, Haryana and Rajasthan cause a thick blanket of smog to cover Delhi-NCR. According to a study, the burning of crop residue released about 149 million tonnes of carbon dioxide, more than 9 million tonnes of carbon monoxide, 0.25 million tonnes of oxides of sulphur (SOX), 1.28 million tonnes of particulate matter (PM) and 0.07 million tonnes of black carbon. As evident, it contributes to a lot of greenhouse gas emissions.
- Firecrackers, although not the top reason for air pollution, also contributes to the problem.
Measures to control Air Pollution in Delhi and adjoining regions
- The Ministry of Environment, Climate Change and Forests notified the Graded Response Action Plan (GRAP) in 2017. These are institutionalised measures to be taken only when the air quality in Delhi NCR deteriorates beyond a certain threshold. It is only to be implemented in emergency situations.
- In October 2020, the Supreme Court-appointed a one-man committee, Justice Lokur Committee, to monitor and curb the occurrences of stubble burning in Punjab, Haryana and Uttar Pradesh.
- Construction & demolition (C&D) waste management rules have been notified which mandate the segregation of C&D waste into various categories for safe disposal and further processing.
- Red Light On, Gaadi Off campaign was an initiative by the Delhi Government that ran in Oct-Nov 2020 under which commuters driving vehicles were urged to switch off their vehicle engines while waiting for the green light at traffic lights.
- The Odd-even rule was introduced by the Delhi Government according to which vehicles with odd and even registration numbers would ply on the road on alternate days. This was particularly aimed at reducing smog in the region.
- The state government of Delhi also introduced a policy to preserve and plant trees in a bid to increase the green cover and have carbon sinks.
- Anti-smog guns and smog towers are installed and used in the city.
- Prevention of stubble burning is a key component of reducing air pollution in the Delhi NCR area. A subsidy is provided to the farmers for procuring the Turbo Happy Seeder, which is a machine fitted on tractors that can cut and uproot stubble and eliminates the need to burn stubble.
- Mass Rapid Transport System (MRTS) is being built as a means to provide citizens with non-polluting alternative sources of transportation.
- Commission for Air Quality Management in National Capital Region and Adjoining Areas Bill, 2021
- The Commission for Air Quality Management in National Capital Region and Adjoining Areas Bill, 2021 provides for the constitution of a Commission for better co-ordination, research, identification, and resolution of problems related to air quality in the National Capital Region (NCR) and adjoining areas.
- Adjoining areas have been defined as areas in Haryana, Punjab, Rajasthan, and Uttar Pradesh, adjoining the National Capital Territory of Delhi and NCR, where any source of pollution may cause adverse impact on air quality in the NCR.
- Sources of air pollution particularly in the NCR consist of a variety of factors which are beyond the local limits. Therefore, a special focus is required on all sources of air pollution which are associated with different economic sectors, including power, agriculture, transport, industry, residential and construction.
- Since air pollution is not a localised phenomenon, the effect is felt in areas even far away from the source, thus creating the need for regional-level initiatives through inter-State and inter-city coordination in addition to multi-sectorial synchronisation.
- The Bill has taken into consideration the concerns of the farmers following several rounds of negotiations, after they had raised concerns of stiff penalties and possible jail terms for stubble burning.
Lessons from Beijing
The UN Environment Programme’s review of Beijing’s control of air pollution provides useful lessons for policymakers. The population size of both cities, Beijing and Delhi, is comparable.
- The need is to deal with urban air pollution in three stages. It starts with end-of-pipe air pollution control gradually moving to integrated measures targeting primary pollutants (SO2, NO2, PM10, and CO), with the Government playing the main role. Later, secondary pollutants, or particulate matter leading to smog, primarily PM2.5, become the main focus for control.
- In Beijing what really made a difference was not shutting down polluting units, restricting car ownership and travel, and improved fuel standards but the approach to urbanisation. Beijing provides more space for public transport and mixed land use spatial planning minimising travel.
- In Beijing, policy focus gradually changed from gasoline vehicle emissions to heavy-duty diesel vehicle emissions. Phasing out older vehicles made the most significant contribution. Beijing plans to have 48 lakh charging points by 2022 to push the use of electric vehicles.
- Innovative implementation steps were instituted in Beijing, like economic incentives were tailored for the specific problem. Municipal environmental enforcement teams do specific inspections and hotspot grid supervision based on a detailed emission inventory for each source.
-Source: The Hindu
Should the state stop focusing on population control?
Context:
According to the recently released National Family Health Survey (NFHS)-5, India’s Total Fertility Rate (TFR), which is the number of children a woman would have in the course of her life, is 2, a decrease from 2.2 in NFHS-4. This raises the question of whether governments should stop focusing on population control.
Relevance:
GS-I: Indian Society (Population and associated issues), GS-II: Social Justice and Governance (Issues Related to Women, Governance and Government Policies, Issues Arising Out of Design & Implementation of Policies)
Dimensions of the Article:
- Distribution and Density of Population
- Determinants of Population Change:
- Two-Child Policy in Indian States
- Criticisms related to two- child policy
- Pointers from the NFHS-5 regarding population control
Distribution and Density of Population
- Patterns of population distribution and density help us to understand the demographic characteristics of any area.
- The term ‘Population Distribution’ refers to the manner in which people are spaced over the earth’s surface and the term ’population density’ refers to the number of people living in each unit of area (such as a square mile).
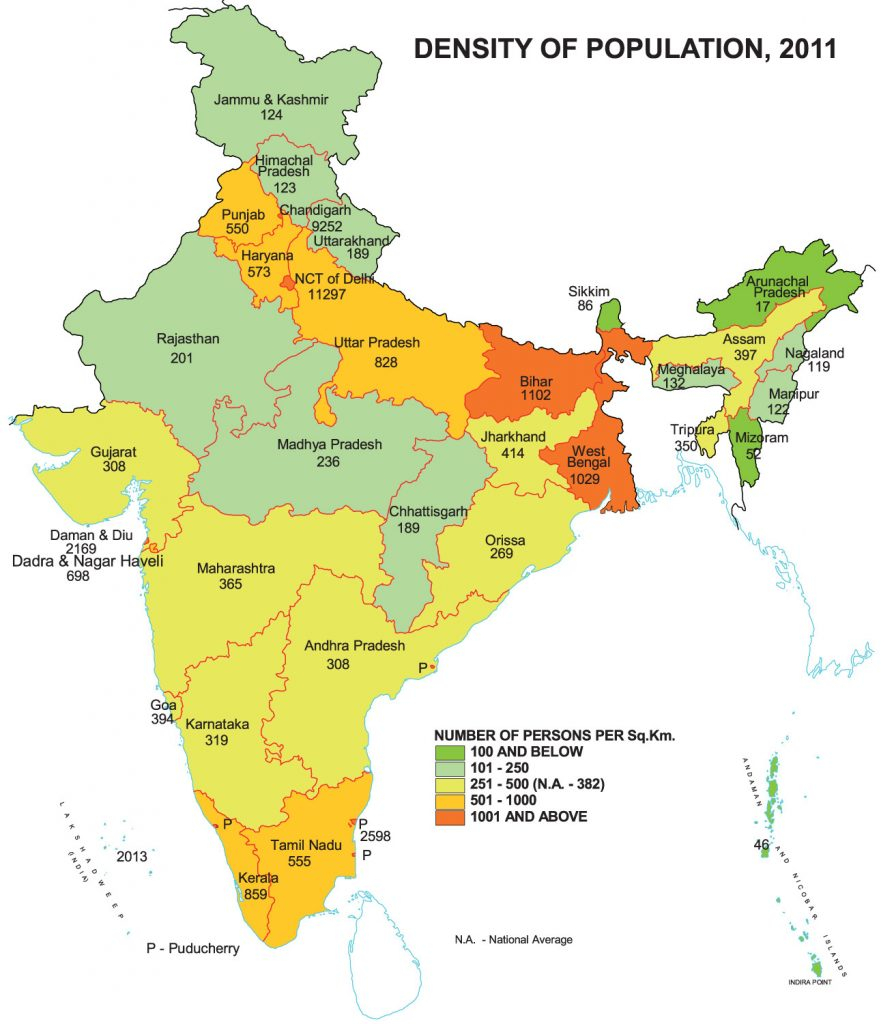
- India has a total population of 121 crores (or 1.21 billion) according to Census, 2011. Further, India’s population currently stands at 1.37 billion (2019, United Nations Population Division.), which accounts for approx. 17% of the world’s population.
- These 1.37 billion people are unevenly distributed over our country’s vast area of 3.28 million square km, which accounts for 2.4 per cent of the world’s area. India’s population density therefore stands at 382 persons per square km.
- The eastern region had the highest density of population of 625 persons per square km.
- However, the North East had the lowest density at 176 persons per sq km. The eastern region was followed by the central Indian region in terms of density (417).
- The southern Region had a population density of 397, while the western region, 344 and the Northern Region, 267. In terms of increase, the population densities of the regions of Central India, Northern India and Eastern India grew at a higher pace than the Western, North Eastern and Southern region.
Determinants of Population Change:
- Fertility: The fertility rate refers to the number of live births per 1000 women in the child-bearing age group, usually taken to be 15 to 49 years.
- Total Fertility Rate: It refers to the total number of live births that a woman would have if she lived through the reproductive age group and had the average number of babies in each segment of this age group as determined by the age-specific fertility rates for that area.
- “Replacement level fertility” is the total fertility rate—the average number of children born per woman—at which a population exactly replaces itself from one generation to the next, without migration. This rate is roughly 2.1 children per woman for most countries, although it may modestly vary with mortality rates.
- Determinants of High Fertility: As per data given by the Niti Aayog for the year 2016, the TFR for Indian women stood at 2.3. This is high and several factors contribute to the same:
- Religious Ideologies
- Universality of the institution of marriage.
- Early marriage and early child-bearing.
- Preference for sons ingrained in the Indian culture.
- Lack of right of self-determination with reference to reproduction.
- High infant and child mortality rates – (unsatisfactory health, low nutritional status and poverty) also contribute to a large family size.
- Economic, social, cultural as well as religious value of children in the Indian society.
- Absence of adoption of methods of conception control.
Two-Child Policy in Indian States
- Maharashtra: Maharashtra is one of the few states in the country that have a ‘two children’ policy for appointment in government jobs or even for the elections of some local government bodies. The Maharashtra Zilla Parishads And Panchayat Samitis Act disqualifies people who have more than two children from contesting local body elections (gram panchayats to municipal corporations). The Maharashtra Civil Services (Declaration of Small Family) Rules, 2005 states that a person having more than two children is disqualified from holding a post in the state government. Women with more than two children are also not allowed to benefit from the Public Distribution System.
- Rajasthan: For government jobs, candidates who have more than two children are not eligible for appointment. The Rajasthan Panchayati Raj Act 1994 says that if a person has more than two children, he will be disqualified from contesting election as a panch or a member. However, the previous BJP government relaxed the two-child norm in case of a disabled child.
- Madhya Pradesh: The state follows the two-child norm since 2001. Under Madhya Pradesh Civil Services (General Condition of Services) Rules, if the third child was born on or after January 26, 2001, one becomes ineligible for government service. The rule also applies to higher judicial services.
- Telangana and Andhra Pradesh: Under Telangana Panchayat Raj Act, 1994, a person with more than two children shall be disqualified from contesting election. However, if a person had more than two children before May 30, 1994, he or she will not be disqualified.
- Gujarat: In 2005, the government amended the Gujarat Local Authorities Act. The amendment disqualifies anyone with more than two children from contesting elections for bodies of local self-governance — panchayats, municipalities and municipal corporations.
- Uttarakhand: The state government had decided to bar people with more than two children from contesting panchayat elections and had passed a Bill in Vidhan Sabha in this regard. But the decision was challenged in the High Court by those preparing for village pradhan and gram panchayat ward member elections, and they got relief from the court. Hence, the condition of two-child norm was applied to only those who contested the elections of zila panchayat and blocks development committee membership.
- Odisha: The Odisha Zilla Parishad Act bars those individuals with more than two children from contesting.
- Assam: The Assam government announced in 2019 that people who have more than two children will not be eligible for government jobs, with effect from 1 January 2021. The Assam Chief Minister also said that barring the tea plantation workers, Scheduled Castes and Scheduled Tribes, people with more than two children would gradually not be able to avail benefits under specific schemes funded by the State. This will be in addition to the amendment made in 2018 to the Assam Panchayat Act, 1994, which requires a two-child norm along with minimum educational qualifications and functional sanitary toilets for contesting the rural polls.
States with draft bills or plans as of 2021
Uttar Pradesh: The policy proposes five key targets: population control; ending curable maternal mortality and illnesses; ending curable infant mortality and ensuring betterment in their nutrition status; betterment of sexual and reproductive health-related information and facilities among the youth; and care of elders. The U.P. government’s law commission has also prepared a population control bill, under which a two-child norm will be implemented and promoted. As per the draft, violation of the policy is penalised with measures such as barring for elections and abidance is rewarded with measures such as promotion in jobs, subsidy etc.
Karnataka: The Karnataka (Gram Swaraj and Panchayat Raj) Act, 1993 does NOT bar individuals with more than two children from contesting elections to local bodies like the gram panchayat. The law, however, says that a person is ineligible to contest “if he does not have a sanitary latrine for the use of the members of his family”.
Criticisms related to two- child policy
- Critics argue that the population growth of India will slow down naturally as the country grows richer and becomes more educated.
- There are already well-documented problems with China’s one-child policy, namely the gender imbalance resulting from a strong preference for boys and millions of undocumented children who were born to parents that already had their one child.
- By interfering with the birth rate, India faces a future with severe negative population growth, a serious problem that most developed countries are trying to reverse. With negative population growth, the number of old people receiving social services is larger than the young tax base that is paying for the social services.
- The law related may also be anti-women. Human rights activists argue that the law discriminate against women right from birth (through abortion or infanticide of female fetuses and babies).
- A legal restriction to two children could force couples to go for sex-selective abortions as there are only two ‘attempts’.
Pointers from the NFHS-5 regarding population control
- The latest data from the National Family Health Survey-5 (NFHS-5) provides evidences of:
- An uptake in the use of modern contraceptives in rural and urban areas
- An improvement in family planning demands being met
- A decline in the average number of children borne by a woman
- The analysis of the data by the international non-profit Population Council (PC) shows that the Total Fertility Rate (number of children born per woman) has decreased across 14 out of 17 States and is either at 2.1 children per woman or less.
- This also implies that most States have attained replacement level fertility, i.e., the average number of children born per woman at which a population exactly replaces itself from one generation to the next.
- While during NFHS-3 and NFHS-4, conducted between 2005 and 2016, there was a decline in the use of modern methods of contraception (oral pills, condoms, intra-uterine device) across 12 of 22 States and UTs, in NFHS-5 as many as 11 out of 12 States where there was a slump have witnessed an increase in their use.
- The indicator to gauge the demand met for contraception has also increased — only five States had more than 75% demand being met in NFHS-4, but now 10 States are able to cater to the demand for family planning by up to 75%.
- The top performers here are Andhra Pradesh, Karnataka and Telangana.
-Source: The Hindu


