Context:
- Rising Covid-19 cases, faltering growth and rising inflation have brought India’s central bank to square one, as it was clear to everyone that India’s GDP growth rate will plummet when the nationwide lockdown was announced.
- This raises the question – Will the price level in India fall, or rise or rise at a slowing pace or rise at a progressively increasing pace (galloping inflation)?
Relevance:
GS-III: Indian Economy (Economic Growth and Development, Planning usage and Mobilisation of resources, Inclusive growth and issues therein)
Dimensions of the Article:
- What is Inflation?
- Types of Inflation based on rate of Increase
- Other types of Inflation
- Did the Covid-induced disruption raise prices or deflate them?
- What is the policy significance of this?
What is Inflation?
- Inflation refers to the consistent rise in the prices of most goods and services of daily or common use, such as food, clothing, housing, recreation, transport, consumer staples, etc. Inflation measures the average price change in a basket of commodities and services over time.
- A moderate level of inflation is required in the economy to ensure that production is promoted. Excess Inflation is indicative of the decrease in the purchasing power of a unit of a country’s currency. This could ultimately lead to a deceleration in economic growth.
- In India, inflation is primarily measured by two main indices — WPI (Wholesale Price Index) and CPI (Consumer Price Index) which measure wholesale and retail-level price changes, respectively.
Types of Inflation based on rate of Increase
There are four main types of inflation, categorized by their speed. They are creeping, walking, galloping, and hyperinflation.
I. Creeping Inflation
- Creeping or mild inflation is when prices rise 3% a year or less. According to the Federal Reserve, when prices increase 2% or less, it benefits economic growth.
- This kind of mild inflation makes consumers expect that prices will keep going up. That boosts demand. Consumers buy now to beat higher future prices. That’s how mild inflation drives economic expansion.
II. Walking Inflation
- When prices rise by more than 3% but less than 10% per annum (i.e., between 3% and 10% per annum), it is called as Walking Inflation.
- It is harmful to the economy because it heats-up economic growth too fast.
- People start to buy more than they need to avoid tomorrow’s much higher prices. This increased buying drives demand even further so that suppliers can’t keep up and neither can the wages. As a result, common goods and services are priced out of the reach of most people.
III. Galloping Inflation
- When inflation rises to 10% or more (i.e., prices rise by double- or triple-digit inflation rates like 30% or 400% or 999% per annum), it wreaks absolute havoc on the economy. It is also referred as jumping inflation.
- Money loses value so fast that business and employee income can’t keep up with costs and prices.
- Foreign investors avoid the country, depriving it of needed capital. The economy becomes unstable, and government leaders lose credibility.
IV. Hyperinflation
- Hyperinflation refers to a situation where the prices rise at an alarming high rate – i.e., more than 50% a month.
- The prices rise so fast that it becomes very difficult to measure its magnitude. However, in quantitative terms, when prices rise above 1000% per annum (quadruple or four-digit inflation rate), it is termed as Hyperinflation.
- Most examples of hyperinflation occur when governments print money to pay for wars.
- Examples of hyperinflation include Germany in the 1920s, Zimbabwe in the 2000s, and Venezuela in the 2010s.
- During a worst-case scenario of hyperinflation, value of national currency (money) of an affected country reduces almost to zero. Paper money becomes worthless and people start trading either in gold and silver or sometimes even use the old barter system of commerce.
V. Chronic Inflation
- If creeping inflation persist (continues to increase) for a longer period of time then it is often called as Chronic or Secular Inflation.
- Chronic Creeping Inflation can be either Continuous (which remains consistent without any downward movement) or Intermittent (which occurs at regular intervals).
- It is called chronic because if an inflation rate continues to grow for a longer period without any downturn, then it possibly leads to Hyperinflation.
VI. Moderate Inflation
- Concept of Creeping and Walking inflation clubbed together are called Moderate Inflation.
- When prices rise by less than 10% per annum (single digit inflation rate), it is known as Moderate Inflation.
- It is a stable inflation and not a serious economic problem.
VII. Running Inflation
- A rapid acceleration in the rate of rising prices is referred as Running Inflation.
- When prices rise by more than 10% per annum, running inflation occurs.
- Though economists have not suggested a fixed range for measuring running inflation, we may consider price rise between 10% to 20% per annum (double digit inflation rate) as a running inflation.
Other types of Inflation
Stagflation
- Stagflation is when economic growth is stagnant, but there still is price inflation.
- High levels of inflation reduce confidence and increase uncertainty (difficult to predict the future). This reduces investment, increases levels of imports, reduces exports, depreciates the value of the local currency, increases unemployment and reduces economic growth. This increase in prices together with rising unemployment is referred to as “stagflation”.
Deflation
- Deflation means a fall in the general level of prices over a period of time. In this case – inflation rate becomes negative
- Deflation is the opposite of inflation. It’s when prices fall. It’s caused when an asset bubble bursts.
- A reduction in money supply or credit availability is the reason for deflation in most cases
Based on measurement:
Core Inflation
- The core inflation rate measures rising prices in everything except food and energy. This measure of inflation excludes these items because their prices are much more volatile.
- A dynamic consumption basket is considered the basis to obtain core inflation. Some goods and commodities have extremely volatile price movements. Core inflation is calculated using the Consumer Price Index (CPI) by excluding such commodities.
Headline inflation
- Headline inflation is a measure of the total inflation within an economy, including commodities such as food and energy prices (e.g., oil and gas), which tend to be much more volatile and prone to inflationary spikes.
- Headline inflation may not present an accurate picture of an economy’s inflationary trend since sector-specific inflationary spikes are unlikely to persist.
- The difference between Headline inflation and Core inflation is that “core inflation” (also non-food-manufacturing or underlying inflation) is calculated from a consumer price index EXCLUDING the volatile food and energy components, whereas “headline inflation” includes such commodities.
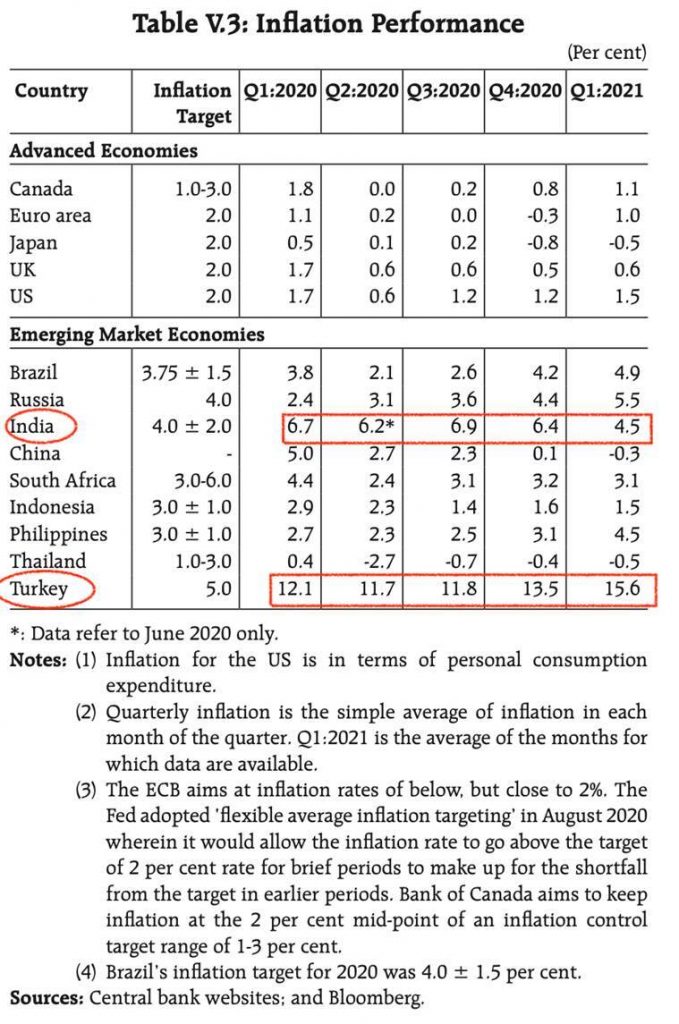
Did the Covid-induced disruption raise prices or deflate them?
- The latest Monetary Policy Report of the RBI has a neat chart which shows that, unlike most advanced and emerging economies, India saw prices going out of its central bank’s comfort zone.
- In this list, only Turkey performed worse than India in containing price rise.
What is the policy significance of this?
- India’s growth was decelerating before the onset of the Covid pandemic and as such, right through 2019, the RBI was in the mode to cut interest rates and incentivise economic activity.
- For the most part, it did not have to worry much about retail inflation at the time. The RBI doubled down on this resolve when the economy got hit by the Covid pandemic in March-end last year.
- Right through the past financial year — April 2020 to March 2021 — the RBI kept signalling that it would support growth and in doing so allowed the inflation rate to stay out of its mandated range.
- In other words, the RBI accorded primacy to boosting GDP growth instead of meeting its legal requirement of maintaining inflation within the mandated range.
- On paper, the argument was that as and when the economy revives, the RBI would revisit its stance and re-start (in a manner of speaking) targeting inflation instead of growth.
- To be sure, several observers were of the view that the Indian economy had posted a very sharp recovery in the second half of the past financial year — that is from October 2020 to March 2021.
- But by the time the RBI’s Monetary Policy Committee met earlier this month — April 5 to 7 — to decide on its policy stance, India was already in the grip of the second Covid wave.
- The daily new caseload had already crossed the previous high and was well past the 1-lakh mark. That meant the RBI was back to square one: Yet again in April, Covid had disrupted India’s already iffy growth trajectory and forced the RBI to choose between boosting growth and containing inflation.
- To be sure, not only did retail inflation continue to be high in March 2021 but even the wholesale inflation spiked to over 7%.
-Source: Indian Express


