Content :
- India’s Economic Surge
- India’s Story on Bridging Inequality
India’s Economic Surge
India’s Economic Performance (2024–25): A Bird-view
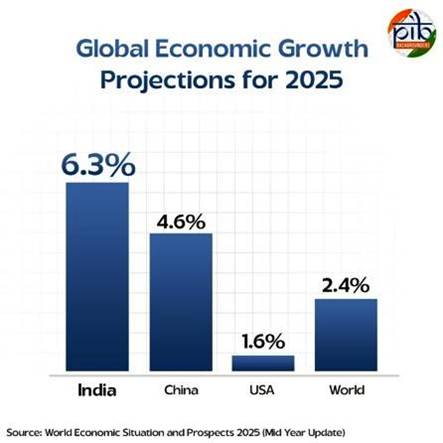
- Fastest growing major economy: Real GDP grew 6.5%, expected to continue into 2025–26.
- Global context: Growth amid global slowdown and trade uncertainties.
- Macro stability: Supported by robust domestic demand, easing inflation, capital market activity, and export growth.
Relevance : GS 3(Indian Economy , Growth)
Robust GDP Growth
- 6.5% real GDP growth in 2024–25; nominal GDP rose 9.9%.
- India’s GDP tripled in a decade: ₹106.57 lakh crore (2014–15) → ₹331.03 lakh crore (2024–25).
- Growth driven by:
- Rural and urban consumption revival
- Private investment surge
- High public infrastructure spending
- Global projections: UN (6.3–6.4%), CII (6.4–6.7%) for 2025–26.
Inflation Under Control
- CPI inflation dropped to 2.82% in May 2025 — lowest since Feb 2019.
- Food inflation fell to 0.99%, with urban and rural rates nearly identical.
- RBI outlook: Inflation likely to stay below 4% target due to good crop output and soft global commodity prices.
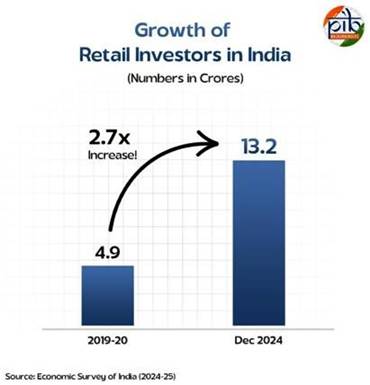
Market Confidence at Record Levels
- Retail investors: Jumped from 4.9 cr (2019) to 13.2 cr (2024).
- Booming IPO market:
- 259 IPOs between Apr–Dec 2024 (↑32.1%)
- Capital raised: ₹1.54 lakh crore (↑190%)
- India’s share in global IPOs: 30% (highest worldwide)
- Stock markets outperformed other emerging economies, indicating investor trust.
Strengthening External Sector
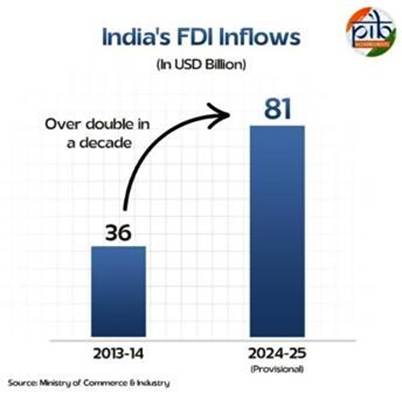
Foreign Direct Investment
- FDI inflows: USD 81.04 billion in FY 2024–25 (↑14% YoY).
- Top sectors:
- Services (19%)
- Software & hardware (16%)
- Trading (8%)
- Manufacturing FDI up by 18%, services FDI up 40.77%.
Foreign Exchange Reserves
- Reserves at USD 697.9 billion (June 2025) — cover over 11 months of imports.
- External debt at a healthy 19.1% of GDP.
Current Account Balance
- Q4 surplus: USD 13.5 billion (1.3% of GDP).
- Full-year CAD contained at 0.6% of GDP, aided by strong services exports and remittances.
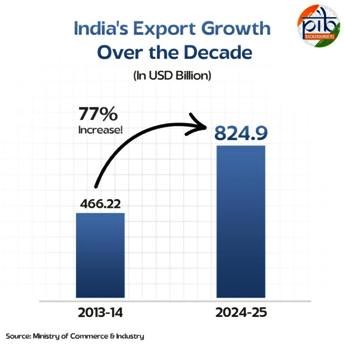
Manufacturing and Export Momentum
- Total exports at all-time high: USD 824.9 billion (↑6.01% YoY).
- Services exports: USD 387.5 billion (↑13.6%)
- Non-petroleum merchandise exports: USD 374.1 billion (↑6.0%)
- Strong gains in:
- IT, consulting, finance
- Machinery, chemicals, electronics, defence
- Manufacturing GVA: ₹15.6 lakh crore (2013–14) → ₹27.5 lakh crore (2023–24)
- Sector’s share stable at ~17.3%
Conclusion: India’s Balanced Growth Model
- High growth + Low inflation = rare macroeconomic stability.
- Investor confidence at all-time high.
- Resilient external sector adds global trust.
- Despite external risks, India is positioned as a pillar of global economic growth with long-term sustainability and inclusive potential.
India’s Story on Bridging Inequality
India: Among World’s Most Equal Societies
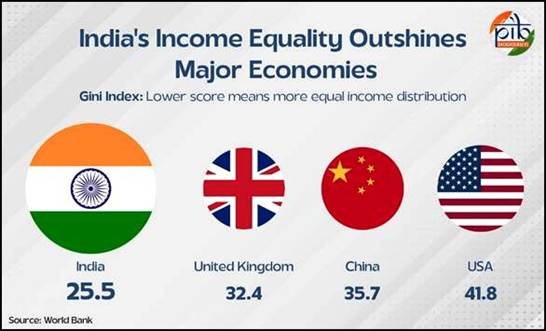
- India ranks 4th globally in income equality (Gini Index: 25.5), behind Slovak Republic (24.1), Slovenia (24.3), Belarus (24.4).
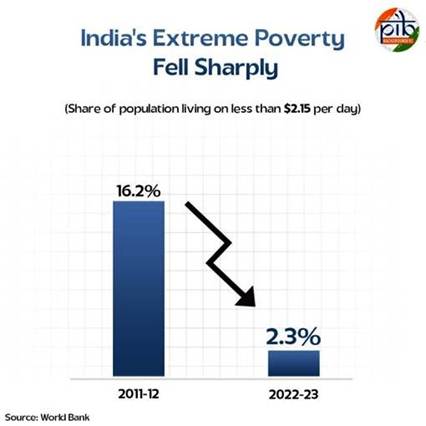
- Extreme poverty fell to 2.3% in 2022–23 (from 16.2% in 2011–12).
- 171 million Indians exited extreme poverty between 2011–2023.
Relevance : GS 2(Governance, Welfare)
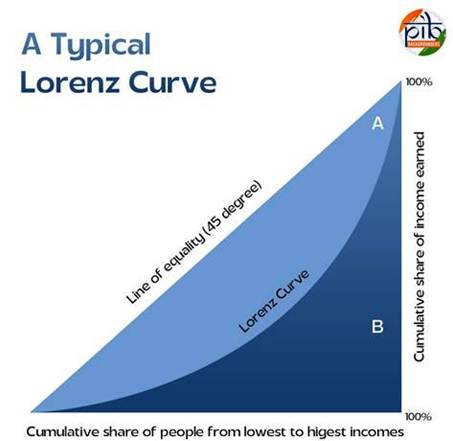
Understanding Gini Index
- Measures income inequality on a scale of 0 (perfect equality) to 100 (absolute inequality).
- India’s 2022 Gini: 25.5, improved from 28.8 in 2011—shows consistent equity gains.
- Graphically derived from the Lorenz Curve, measuring deviation from perfect equality.
Global Comparison
- India’s inequality level is lower than China (35.7) and the USA (41.8).
- India scores better than all G7 & G20 countries (including UK, Germany, France, Canada, Japan).
- Part of the elite group of ~30 countries in the “moderately low inequality” category (Gini 25–30).
Poverty Reduction = Equality Rise
- Share of population under $2.15/day fell from 16.2% (2011) to 2.3% (2022–23).
- Under updated $3/day poverty line: India’s poverty rate stands at 5.3% (2022–23).
- Urban & rural poverty both sharply declined—reflecting broad-based welfare impact.
Key Government Interventions Driving Equality
PM Jan Dhan Yojana
- 55.69 crore accounts (as of June 25, 2025); drives financial inclusion and benefit access.
Aadhaar Digital Identity
- 142 crore+ Aadhaar IDs; ensures authentic targeting of welfare and subsidies.
Direct Benefit Transfer (DBT)
- ₹3.48 lakh crore in savings by March 2023; plugs leakages, speeds delivery.
Ayushman Bharat (PM-JAY)
- 41.34 crore Ayushman cards, 32,000+ empanelled hospitals.
- Special schemes for senior citizens (Ayushman Vay Vandana).
- 79 crore+ digital health IDs via Ayushman Bharat Digital Mission.
Stand-Up India
- ₹62,807 crore disbursed to 2.75 lakh SC/ST & women entrepreneurs.
- Promotes inclusive entrepreneurship and wealth generation.
PMGKAY (Free Food Scheme)
- 80.67 crore beneficiaries (as of Dec 2024); ensured food security during and after COVID-19.
Vishwakarma Yojana
- 29.95 lakh artisan registrations (as of July 2025); supports traditional livelihoods through credit, training, tools.
What Sets India Apart
- Simultaneous pursuit of economic growth and social justice.
- Combines digital infrastructure, targeted welfare, and inclusive credit systems.
- Policies reach the last mile while also empowering self-reliance.
Conclusion: A Model for Inclusive Growth
- India’s Gini score is more than a statistic—it’s a reflection of policy-driven transformation.
- Equality and development are not opposites but mutually reinforcing.
- India is now a global benchmark for combining economic scale with social fairness.


