Context:
- India has not released its Consumption Expenditure Survey (CES) data since 2011-12. Normally a CES is conducted by the National Sample Survey Office (NSO) every five years.
- But the CES of 2017-18 (already conducted a year late) was not made public by the Government of India. Now, we hear that a new CES is likely to be conducted in 2021-22, the data from which will probably not be available before end-2022.
Relevance:
- GS Paper 2: Poverty and Associated Issues
Mains questions:
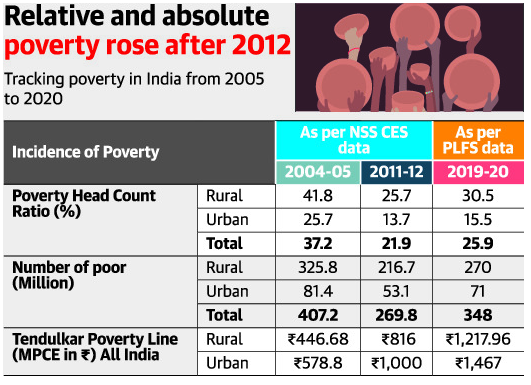
- In the absence of CES data, the Periodic Labour Force Survey shows a rise in the absolute number of the poor. Discuss. 15 Marks
Dimensions of the Article:
- What is the poverty?
- Sen’s 5 dimensions of Poverty:
- Poverty measurement approaches
- Poverty Estimation
- Measures to address the Poverty?
- Way Forward:
What is the poverty?
- According to World Bank, Poverty is pronounced deprivation in well-being, and comprises many dimensions. It includes low incomes and the inability to acquire the basic goods and services necessary for survival with dignity. Poverty also encompasses low levels of health and education, poor access to clean water and sanitation, inadequate physical security, lack of voice, and insufficient capacity and opportunity to better one’s life.
- In India, 21.9% of the population lives below the national poverty line in 2011. Out of the total population living in the rural parts of India, 25.7% is living below the poverty line whereas in the urban areas, the situation is a bit better with 13.7% of the population living below the poverty line.
Sen’s 5 dimensions of Poverty:
In Development as Freedom, Sen outlines five specific types of freedoms:
- political freedoms- refers to the ability of the people to have a voice in government and to be able to scrutinize the authorities.
- economic facilities- concern both the resources within the market and the market mechanism itself.
- social opportunities- deal with the establishments that provide benefits like healthcare or education for the populace, allowing individuals to live better lives.
- transparency guarantees- allow individuals to interact with some degree of trust and knowledge.
- protective security- system of social safety nets that prevent a group affected by poverty being subjected to terrible misery.
Poverty measurement approaches
- Income Approach -Income necessary to buy a minimum basket of goods say 2400 kcal.
- Calorie Consumption Criteria –This means taking the norm of 2400 kcal for rural and 2100 kcal for urban areas in each state individually.
- Consumption Versus Income Level Approach: Poverty line estimation in India is based on the consumption expenditure and not on the income levels because of the following reasons:
- Variation in Income: Income of self-employed people, daily wage laborers etc. is highly variable both temporally and spatially, while consumption pattern are comparatively much stable.
- Additional Income: Even in the case of regular wage earners, there are additional side incomes in many cases, which is difficult to take into account.
- Data Collection: In case of consumption based poverty line, sample based surveys use a reference period (say 30 days) in which households are asked about their consumption of last 30 days and is taken as the representative of general consumption. Whereas tracing the general pattern of income is not possible.
Poverty Estimation
- Planning Commission Expert Group (1962), working group constituted by the Planning Commission formulated the separate poverty lines for rural and urban areas (₹20 and ₹25 per capita per year respectively).
- VM Dandekar and N Rath (1971), made the first systematic assessment of poverty in India, based on National Sample Survey (NSS) data.
- VM Dandekar and N Rath were of the view that poverty line must be derived from the expenditure that was adequate to provide 2250 calories per day in both rural and urban areas.
- Expenditure based Poverty line estimation, generated a debate on minimum calorie consumption norms.
- Alagh Committee (1979): Task force constituted by the Planning Commission under the chairmanship of YK Alagh, constructed a poverty line for rural and urban areas on the basis of nutritional requirements and related consumption expenditure.
- Lakdawala Committee (1993): Task Force chaired by DT Lakdawala, based on the assumption that the basket of goods and services used to calculate Consumer Price Index-Industrial Workers (CPI-IW) and Consumer Price Index- Agricultural Labourers (CPI-AL) reflect the consumption patterns of the poor, made the following suggestions:
- Consumption expenditure should be calculated based on calorie consumption as earlier.
- State specific poverty lines should be constructed and these should be updated using the CPI-IW in urban areas and CPI-AL in rural areas.
- Tendulkar Committee (2009)-Expert group constituted by the Planning Commission and, chaired by Suresh Tendulkar, was constituted to review methodology for poverty estimation and to address the following shortcomings of the previous methods:
- Obsolete Consumption Pattern: Consumption patterns were linked to the 1973-74 poverty line baskets (PLBs) of goods and services, whereas there were significant changes in the consumption patterns of the poor since that time, which were not reflected in the poverty estimates.
- Inflation Adjustment: There were issues with the adjustment of prices for inflation, both spatially (across regions) and temporally (across time).
- Health and Education Expenditure: Earlier poverty lines assumed that health and education would be provided by the state and formulated poverty lines accordingly.
Measures to address Poverty?
- Employment is the sustainable route out of poverty
- Since employment generation has not accompanied growth, elasticity of poverty reduction has remained low.
- Quality of employment is also important as not all poor are unemployed. There is need to create employment in formal sector and highly productive sectors for upward mobility so that households increasingly become part of an economically secure middle class
- Rural poverty reduction: 80% of poor live in rural areas
- Raise Agriculture growth: China case study
- Increase connectivity between rural and urban areas, linkages between agriculture and non-primary sectors.
- Social transformation by inclusion of women and SC/ ST
- Around 20% of women currently participates in labour force.
- Trend in FLFP rate is declining since 2005
- Human development indicators
- This is central to improving their quality of life and income-earning opportunities, raising their productivity and providing the country with new drivers of economic growth.
- They will not automatically improve with growth
- Some problems, such as undernutrition and open defecation, are endemic and not confined to the poor, and have not improved with economic growth.
- Low Income States
- Targeted efforts will be needed to release these states from the twin traps of ‘low income-low growth’ and ‘high poverty-slow poverty decline’
- Social Sector expenditure
- A look at the social sector expenditure over the last few years (see table) shows that the share of education as a percentage of GDP has been stagnant around 2.8-3 per cent during 2014-15 to 2019-20. In the case of health, the expenditure as a percentage of GDP increased from 1.2 per cent to 1.5 per cent. This is lower than the required 2-3 per cent of GDP.
Way Forward:
- The pandemic has also underscored the criticality of certain “essentials” — access to quality healthcare, education and awareness, water and sanitation facilities, adequate nutrition, and the need for living spaces where social distancing can be practiced. Real needs of the people must be factored into any credible assessment of poverty.


