Contents:
- Global Economy in 2019-20
- Indian Economy in 2019-20
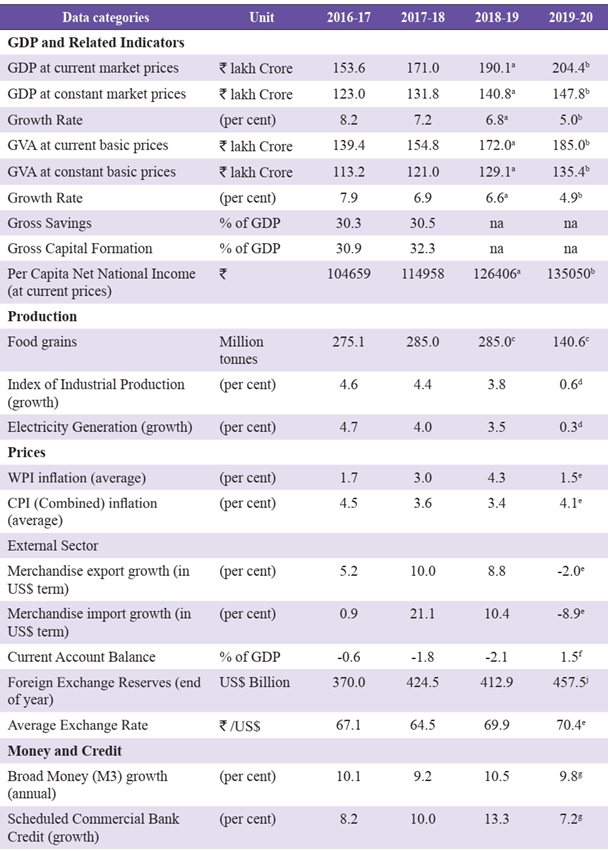
- Size of the Economy
- GVA and GDP growth
- Inflation
- Employment: Formal vs Informal
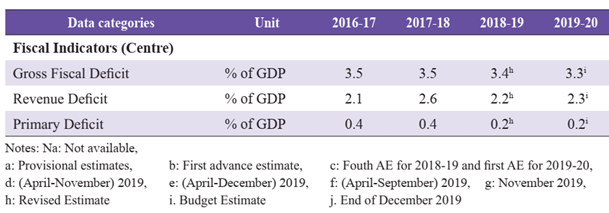
- Fiscal situation
- Monetary Policy
- Credit growth
- External Sector Performance
- Sectoral Development
- Advance Estimates
- Key Indicators
- The Recent Growth Deceleration: Drag of Financial Sector on the Real Sector
- The slowing cycle of growth
- Decline in Fixed investment rate
- Drag of financial sector on private corporate investment
- Decline in household investment
- Delayed decline in private consumption
- Outlook
- Downside Risks
- Upside Risks
- Projection of GDP growth in 2020-21
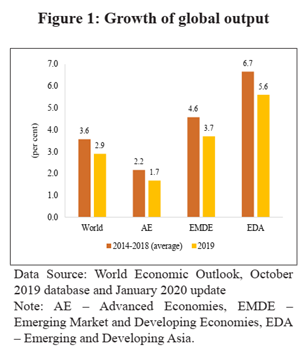
GLOBAL ECONOMY IN 2019-20
- World Economic Outlook (WEO) 2020 — published by IMF
| 2019 | 2018 | 2017 |
| 2.9 | 3.6 | 3.8 |
- 2019 slowest since the global financial crisis — geographically broadbased decline in manufacturing activity and trade.
- Stabilising, yet uncertain, trade tensions between China and the USA.
- India’s Gross Domestic Product (GDP) growth also correlates with the global growth since 2017, not in the previous 3 years
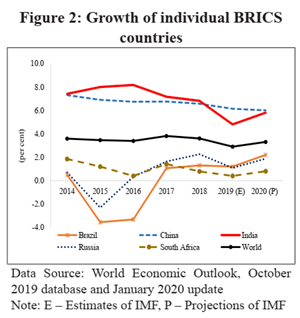
- Rebound expected in 2020 — 3.3 per cent, for India 5.8 per cent contributing significantly (India’s nominal GDP 2019 – $1.7 trillion)
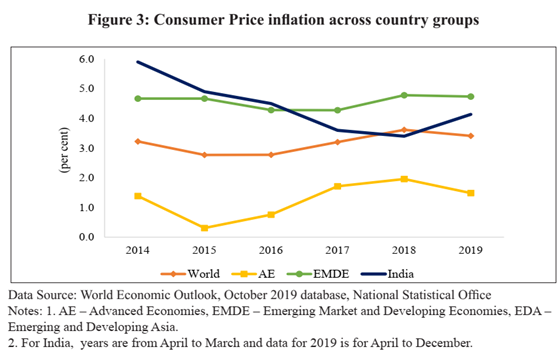
- Inflation: Inflation the world over also remained muted in 2019 — slack in consumer demand, also lower energy prices in 2019
Lower consumer demand –> hurt production in major economies in 2019 –> especially auto sector (mostly caused changes in technology and emission standards) — India no exception
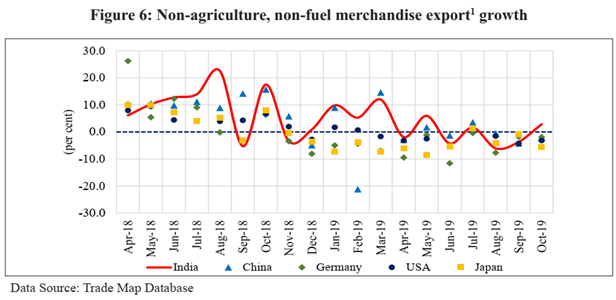
Global industrial activity slowed down –> Lower exports from major economies. India’s exports fell too
- Increasing trade barriers
- trade uncertainty stemming from growing trade tensions
INDIAN ECONOMY IN 2019-20
Size of the Economy
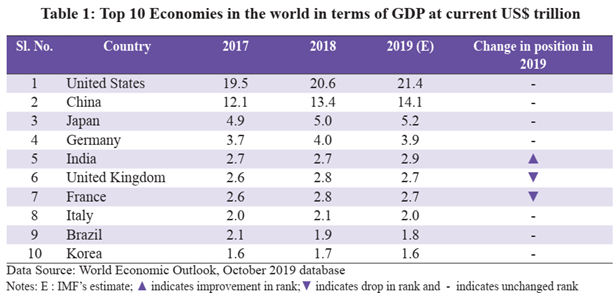
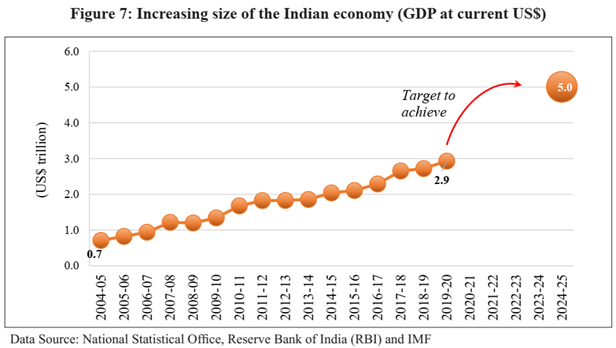
The march towards milestone ($5 tr) challenged by less than expected growth mostly due to a decline in world output. Yet, given India’s macroeconomic stability over the last five years (annual average growth
rate of 7.5 per cent and annual average inflation of 4.5 per cent), the economy is poised for a rebound
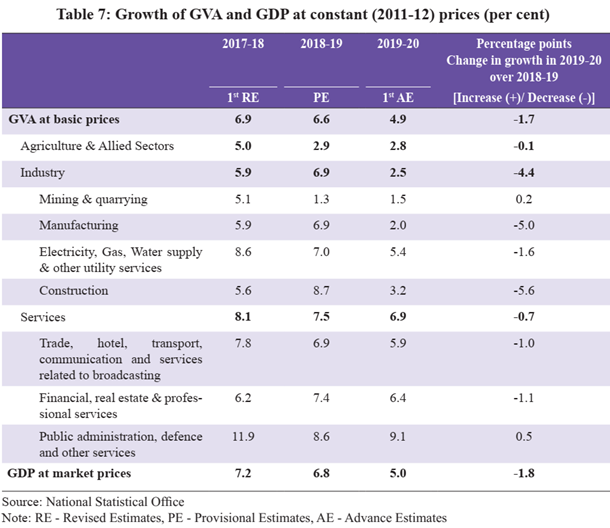
GVA and GDP growth
The National Statistical Office (NSO) estimate – 4.8 per cent in the first half (H1 2019-20)
On the supply side, Deceleration caused by all sectors– save ‘Agriculture and allied activities’ and ‘Public administration, defence, and other services’.
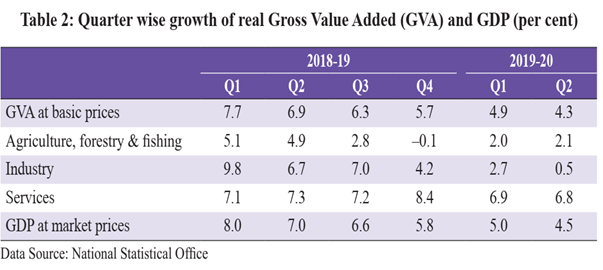
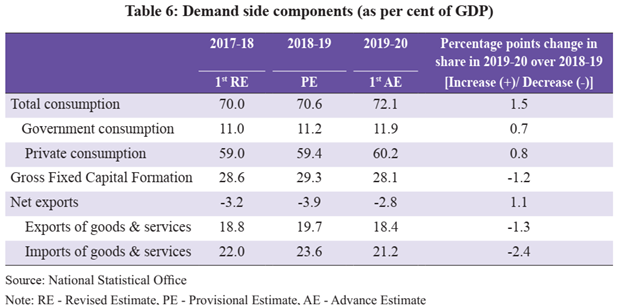
On the demand side, deceleration caused by a decline in the growth of real fixed investment in H1– thanks to sluggish growth of real consumption. However, real consumption picked up from Q2 — driven by government final consumption as also private final consumption expenditure. Further, contraction of exports lesser than imports — lower GDP growth and softer crude prices lowering the import bill
Despite deceleration, the stock market is upbeat
- growing
perception of India becoming an attractive destination for investment in the
backdrop of a decline in the growth of major economies of the world
- continued easing of monetary policy by the US Fed.
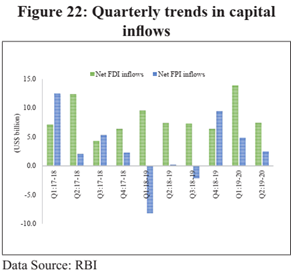
- The net FDI and net Foreign Portfolio Investment is relatively higher in comparison to 2018-19
Business Cycle
It appears that the length of the business cycle is about 13 quarters. In deceleration phase, 9 quarters.
Since 2011-12, India recorded its lowest quarterly GDP growth in Q4 of
2012-13.
- After
13 quarters, the economy achieved its highest quarterly growth of 9.4 per cent
in Q1 of 2016-17.
- Again after 13 quarters, the economy has recorded a low growth of 4.5 per cent in Q2 of 2019-20. A study on business cycle measurement in India
A resurgence in growth is, accordingly, expected starting H2
Inflation
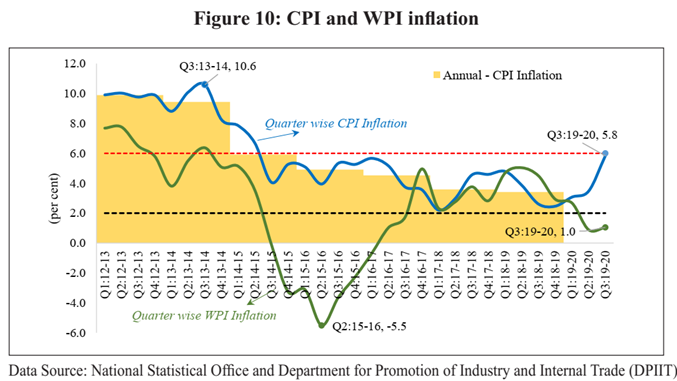
CPI (Headline) showed uptick. The food prices spiked following unseasonal rainfall and a flood-like situation in many parts of the country, which affected agricultural crop production.
The Wholesale Price Index (WPI) inflation, on the other hand, declined sharply reflecting weakening of demand pressure. Core inflation, which further reflects the state of demand in the economy, showed weakening trend
The core-CPI and WPI inflation together moderated inflation, as captured by the GDP deflator, which also fell — significantly lowering nominal growth
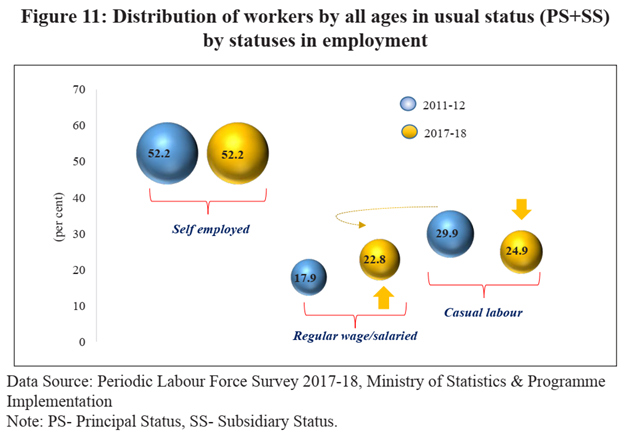
Employment: Formal vs. Informal
Several polices have been implemented to enhance the formalization of the economy
- Periodic Labour Force Survey (PLFS), MOSPI
- Quinquennial surveys on Employment-Unemployment conducted by National Sample Survey Organization (NSSO).
- Annual Survey of Industries (ASI), NSSO
Comparison only superficially to be done because PLFS changed its methodology. This limited comparison shows shift towards increased employability in formal sector jobs.
- Share of formal employment, as captured by ‘Regular wage/salaried’, from 17.9 per cent in 2011-12 to 22.8 per cent in 2017-18 –> 5 % increase with tandem 5% decrease in casual workers
- Remarkable — women workers in ‘Regular wage/salaried’ increased by 8% (from 13 percent in 2011-12 to 21 per cent in 2017-18)
- The drop in casual labour — mostly in rural sector – shifted from agricultural to industrial and services activity.
- In urban region, shift of employment from self- employed to salaried jobs.
Fiscal situation
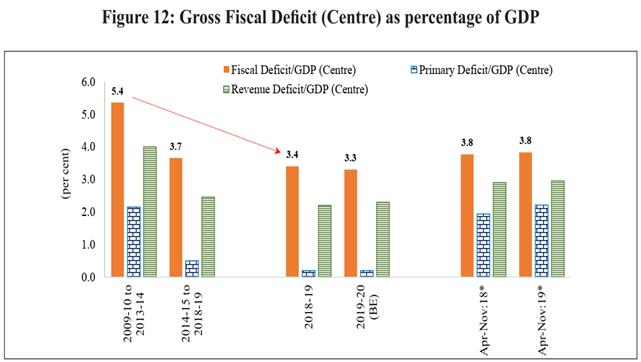
Net Tax revenue to the Centre grew at a slower pace than expected. GST collections, the biggest component of indirect taxes, grew slowly too but uptick since October 2019
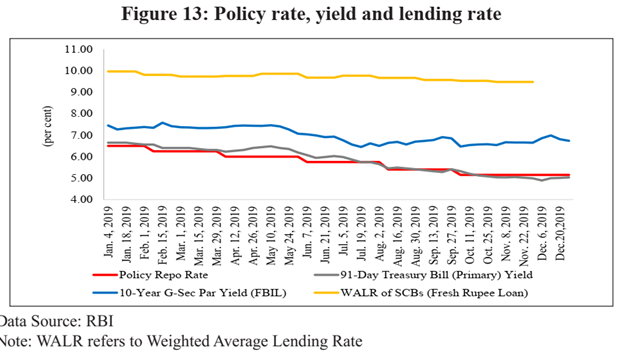
Monetary policy
The liquidity condition of banks became comfortable after June 2019 and has remained so. Durable liquidity injection was undertaken through four open market operation (OMO) purchase auctions and a US$ 5 billion buy/sell swap auction.
Abundant liquidity in the banking system is also reflected in the call money rate, which has mostly traded within the Liquidity Adjustment Facility (LAF) corridor
MPC continued to be accommodative as it reduced the policy repo rate by 135 basis points since February 2019. The rate cut along with excess liquidity in banks was expected to transmit well into lowering interest rates. However, variations in transmission in different market segments
- Short term treasury bills — Full
- Long Term TBs — Partial
- SCBs — only 33 basis points
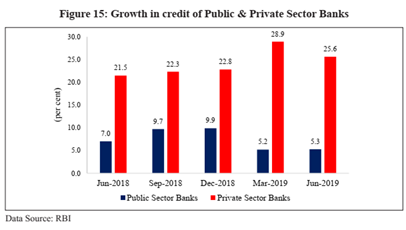
Credit growth
Decelerating in H2 of 2018-19 and further in H1 of 2019-20.
- In all major segments of non-food credit, save personal loans
- Maximum deceleration – Services sector.
- Agriculture and allied activities benefited
Decline in credit growth
- Growing risk aversion of banks — NPA build up — despite 2000 corporate insolvency processes between 2016 -2019
- Despite mobilising same amounts of deposits as compare 2019, SCBs invested thrice the amount in G-secs — Risk aversion
- Risk aversion displayed more by PSBs more than private SCBs
- More so towards lending to private firms
2018 NPA – 11.2% of gross advances
2019 NPA – 9.3%
External sector performance
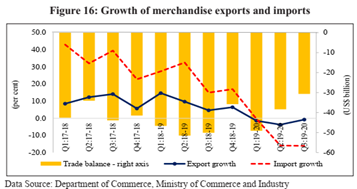
Improvement in trade balance
- Slower contraction of exports (thanks to global pickup) as compared to imports
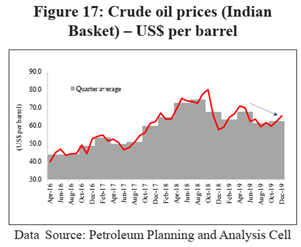
- Lower import bill partly contributed by a decline in oil prices compared to 2018-19
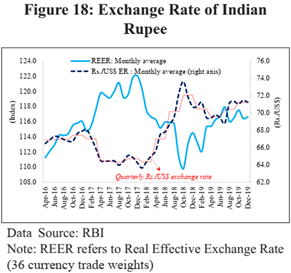
- Depreciation of real exchange rate might have boosted exports for now, but tenuous
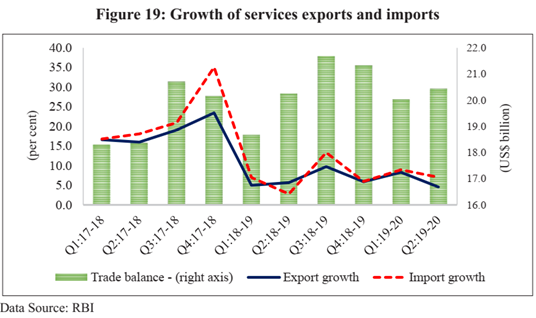
- Muted growth in services exports, but remained positive
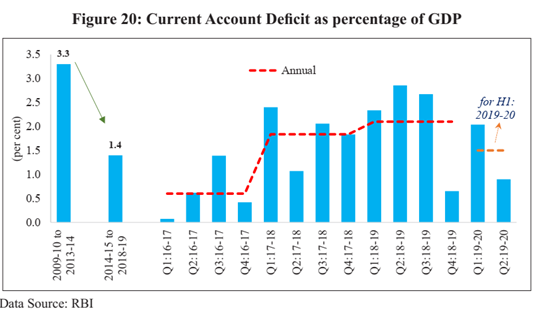
- Lower Current Account Deficit (CAD) — means reduced external indebtedness of the country making domestic economic policy increasingly independent of external influence.
- The CAD, which was 2.1 per cent of GDP in 2018-19, has improved to 1.5 % — result of reduction in trade deficit
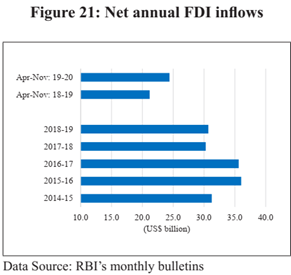
- Foreign Direct Investment (FDI) – more stable source of financing CAD
- FDI robust since 2014, continued in 2019-20
- FDI plus low trade deficit = Higher BOP = $461 bn
Sectoral developments
Resources move across sectors in response to changes in relative prices causing different sectors of the economy to grow at different rates.
- More focus on sectors when growth dips!!
- At all levels of growth structural changes imminent
Share of agriculture and allied sectors — declined from 2009-14 to 2014-19 –> because of higher growth performance of tertiary sectors —
natural outcome of the development process
The contribution of industrial activities to GVA has also declined from 2009-14 to 2014-19.
- Manufacturing sector contributes more than 50 per cent of industrial GVA, has driven the decline….
- Construction sector has also moderated.
Services sector has moved ahead faster
- Financial, real estate and professional services upbeat followed by Public admin
- Even globally, it is services sector supporting growth offsetting decline in manufacturing activity.
FIRST ADVANCE ESTIMATES: 2019-20
Real GDP during 2019-20 is estimated at 5.0 per cent, as compared to the growth rate of 6.8 per cent in 2018-19.
The first Advance Estimates imply that growth in H2 of 2019-20 will witness an uptick over H1:
- NIFTY India Consumption Index picked up for the first time in 2019-20 in Oct 2019
- Secondary market (BSE Sensex)continues to be upbeat
- Foreign investors continue to show confidence — both FDI and FPI
- Lagged effect of previous cuts in the repo rate — build-up of demand pressure.
- CPI-core inflation is rising, as also WPI
- Terms of trade for farmers has been improving and will lead to increase in rural consumption — Rising Food inflation since April 2019
- Industrial activity — picking up — IIP in positive, core showing lesser contraction. PMI Manufacturing and PMI services steady improvement
- Growth in merchandize exports — lesser contraction
- Forex reserves have built up from US$ 413 billion in end March 2019 to US$ 461.2 billion in Jan 2020
- Gross GST revenue collected showing positive growth rate against negative growth rates in 2019.
THE RECENT GROWTH DECELERATION: DRAG OF THE FINANCIAL SECTOR ON THE REAL SECTOR
The Slowing Cycle of growth
Economic Survey, 2018-19 describes the virtuous cycle:
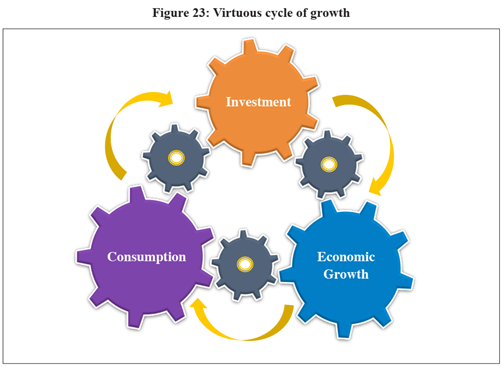
In case of India, the lag between rate of fixed investment and its impact on GDP growth is seen to be of three to four years. Similarly, the impact of GDP growth on consumption growth gets reflected in one to two years. Therefore, a contemporaneous comparison of trends of GDP growth and investment is not appropriate, given the negative correlation seen between the two.
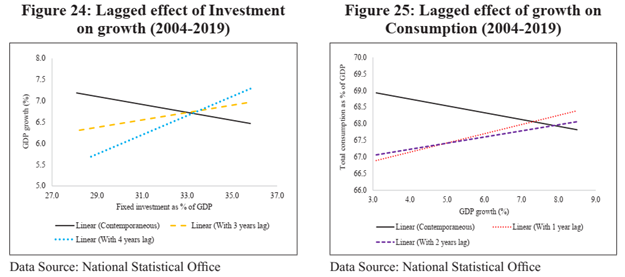
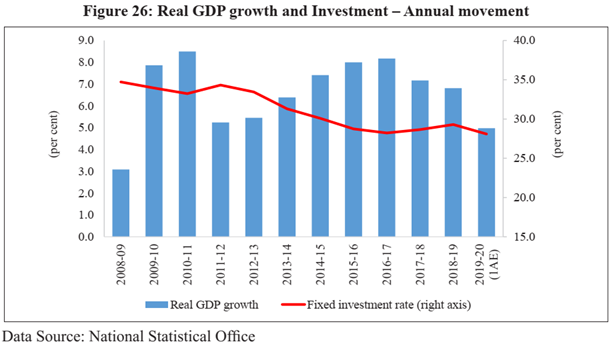
The Indian economy, since 2011-12, has been under the influence of slowing cycle of growth. The fixed investment rate has started declining sharply since 2011- 12 and subsequently plateaued from 2016- 17 onwards. Given the lagged impact of the investment rate on GDP growth, the deceleration in growth since 2017-18 is consistent with
the framework
Decline in fixed investment rate
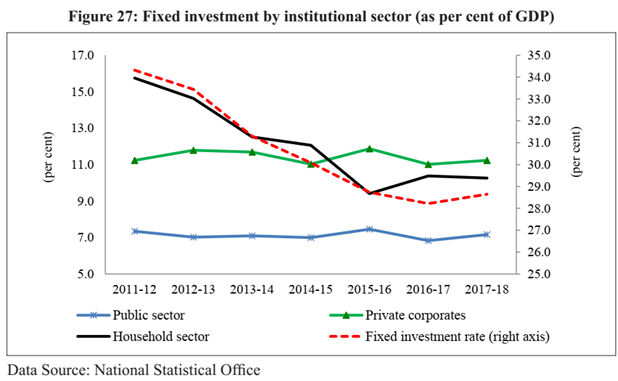
Households: Maximum decline
Public sector: Marginally decreased
Private corporates: Stagnation, almost
…………. explains slowing growth cycle and consumption
Drag of financial sector on private corporate investment
- Decline
in corporate investment stemmed from issues related to the financial sector
- Well recognized fact: a sudden credit expansion, which is purely supply led, results in short lived expansion of output and employment but causes significant contraction in the long run.
- The International Monetary Fund (2017) finds this relationship for 80 countries. In most of these cases, the credit channel works through household debt where households increase demand using debt in the short run and reduce demand later during the deleveraging phase, thereby, resulting in recessions.
- In the Indian context, the credit channel has worked through corporate investment. Enormous lending boom of the mid and late 2000s when non-food bank credit almost tripled between 2003-04 to 2007-08 and doubled between 2007-08 to 2011-12.
- Post the credit boom, the credit growth of banks also started to slow down. The decline in the growth of non-food SCB credit followed a rise in the Non- Performing Assets (NPA) of banks from an average of 3.0 per cent of gross advances in 2009-14 to 8.3 per cent in 2014-19.
Decline in household investment
The household sector includes family households as well as ‘quasi corporates’– Unincorporated enterprises belonging to households, which have complete sets of accounts, are called ‘quasi-corporates’.
‘Quasi-corporates’ invest 2/3rd in ‘Machinery & equipment’ and ‘Dwellings and other Structures’. They supply directly for retail consumption. Also are backend suppliers for incorporated entities.
The stagnation in machinery and equipment investment of households at around 2.4 per cent of GDP, from 2011-12 to 2017-18, can possibly be linked with the levelling of private corporate investment during the same period. Similar decline in household investment in ‘Dwellings, is a reflection of slower growth in purchase of houses by households. Thus real estate sector, and residential property in particular, has been reeling with issues of delayed project deliveries and stalled projects leading to a build-up of unsold inventory over the years.
Housing prices have remained elevated, even though growth in prices has fallen sharply since 2015-16 and remained muted since then.
Delayed decline in private consumption
Private consumption increased from 2009-16, particularly in 2014-16. Thereafter, it declined in 2017-18 and rose again in 2018-19, before declining sharply in H1 of 2019- 20. Thus the effect of GDP growth on consumption manifests after a lag of 1-2 years.
Change in household investment contributed to increasing consumption in the period until 2016-17. A drop in savings in physical assets of households has been observed over this period — most of it directed towards consumption
Household savings used in the form of:
- physical assets
- valuables (gold or silver)
- net household financial savings
- consumption.
OUTLOOK
IMF — World Economic Outlook — 5.8 per cent in 2020-21.
World Bank– Global Economic Prospects — 5.8 per cent in 2020-21.
However there are both the downside and upside risks to an expected acceleration in GDP growth are discussed below.
Downside Risks
- Continued global trade tensions — weaker export performance — low inducement of fixed investment
- Escalation in US-Iran geo-political tensions — may increase oil prices and depreciate rupee. Lower FPI inflows and higher inflation — weakened investment. Full or partial pass-through of oil prices — fiscal deficit and increased yield on G-sec–> increases the cost of capital
- Growth in advanced countries has weakened with very low inflation.
- The conventional monetary policy has almost run its full course.
- Subsequently, quantitative easing may fuel inflation and reduce the real interest rate.
- At some point in future, if short-term interest rates are raised by the central banks to contain inflation, it may result in capital flight from emerging and developing market economies (EMEs) including India.
- The rupee may come under pressure making imports costlier. Leakage from the domestic circular flow of income may increase which may adversely impact private consumption and investment.
- The implementation of IBC Code is progressing slowly. Without speeding it up — risk aversion to lend –> Risk premiums high –non transmission of monetary policy
- Investment in the public sector may increase — after the announcement of the National Infrastructure Pipeline (NIP) of projects worth ` 102 lakh crore — fiscal deficit — bond yields may increase, thereby, possibly crowding out private investment.
- If instead private investment seeks external funding, CAD would widen and depreciate the rupee, bringing in its wake the adverse impact on consumption, investment and growth.
- Should productivity gains not significantly increase with reforms, it may raise the requirement of fixed investment rate to boost economic growth.
- A non-rising gross domestic savings rate may further deteriorate the CAD, depreciate the rupee and make the virtuous cycle more difficult to realize.
Upside Risks
- There are tentative signs that manufacturing activity and global trade are bottoming out. This may positively impact India’s exports. At the same time, there is renewed initiative to boost exports through various reform measures including scaling up of logistics infrastructure that may increase export competitiveness.
- Government’s thrust on affordable housing is evident, in order to boost the real estate sector and consequently the construction activity in the country. Higher investment in housing by households may increase the fixed investment in the economy. Existing unsold housing inventory can be cleared and the balance sheets of both bank/ non-bank lenders cleaned if the real estate developers are willing to take a ‘hair-cut’ by allowing the house-prices to drop.
- Global sentiment continues to favor India as reflected in robust and rising inflows of net FDI into the country. Relocation of investors from other countries to India in the wake of trade tensions will also add to the flow. The announcement of NIP may further increase FDI inflows into the country in both brown-field and green-field infrastructure projects. Continuous relaxation of FDI guidelines may address the concerns of foreign investors and improve the investment climate.
- A boost to Make in India may not only enhance exports but replace imports of products in which India has sufficient scope for expansion in domestic manufacturing.
- India has been making steady progress in improving its rank in the Ease of Doing Business, assessed for about 190 countries by the World Bank. Earlier the rank had improved with the implementation of GST. Lately the improvement in rank has resulted from progress in trade facilitation as cross-border movement of goods has involved lesser waiting time. As the implementation of GST further settles down, the increased unification of the domestic market may reduce business costs and facilitate fresh investment. Reforms in land and labor market may further reduce business costs.
- Reduction in the base corporate tax rate to 15 per cent for new manufacturing companies may increase the rate of return on investment above the hurdle rate of the cost of capital and encourage a surge in new investments.
- Merger of public sector banks may increase the financial strength of the merged entities, lower the risk aversion and result in lowering of lending rates.
Projection of GDP growth in 2020-21
On a net assessment, it appears that the upside risks should prevail, particularly when the government, with a strong mandate, has the capacity to deliver expeditiously on reforms. GDP growth of India should strongly rebound in 2020-21 and more so on a low statistical base of 5 per cent growth in 2019-20.
On a net assessment of both the downside/upside risks, India’s GDP growth is expected to grow in the range of 6.0 to 6.5 per cent in 2020-21.


