09 June 2026 · The Hindu
Contents
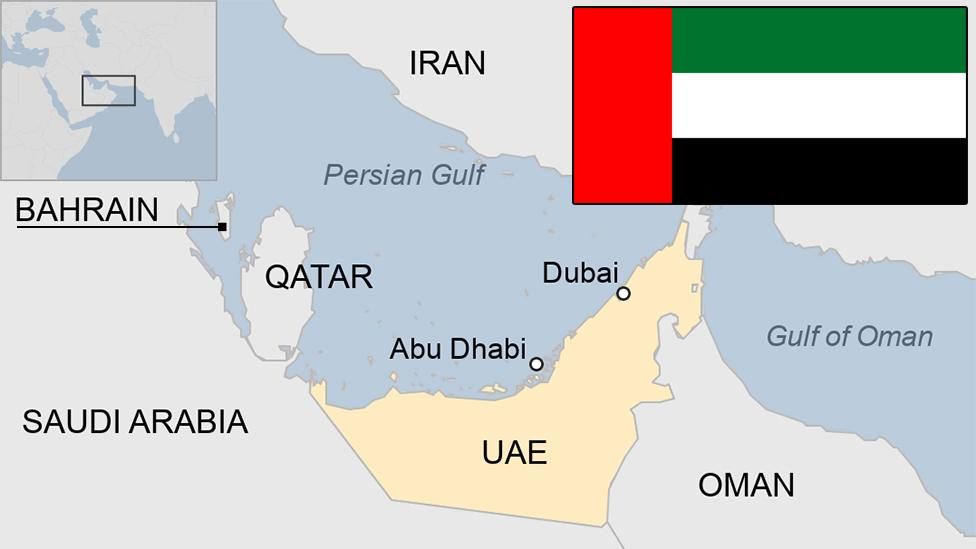
The Oman CEPA — A New Gateway for India’s Exports
- The India-Oman Comprehensive Economic Partnership Agreement (CEPA) came into force on June 1, 2026, building on thousands of years of commercial and maritime ties between the two nations and providing a modern legal framework for deepening trade, investment, and economic cooperation.
- Bilateral trade has grown from $8.94 billion (FY2023-24) to $11.18 billion (FY2025-26), reflecting growing complementarities; the CEPA is designed to accelerate this trajectory by eliminating tariff barriers across a broad swath of Indian export sectors.
- The agreement arrives as India actively diversifies its trade partnerships — following CEPAs with UAE, Australia, EFTA, UK, New Zealand, and the EU — and seeks deeper integration with global value chains centred on the Gulf, a region critical to India’s energy security and strategic interests.
- The editorial’s central claim: the CEPA’s real test lies not in the text of the agreement but in implementation and utilisation — whether Indian businesses across sectors and states actively leverage the preferences created, or whether the agreement remains underused as has happened with earlier FTAs.
- A Comprehensive Economic Partnership Agreement (CEPA) is a broader instrument than a traditional Free Trade Agreement — it covers goods (tariffs, NTBs), services (mode-wise commitments), investment (protection, facilitation), intellectual property, and regulatory cooperation, making it the most advanced form of bilateral economic treaty India concludes.
- India’s first CEPA was with Singapore (2005); the Gulf region CEPA template was developed with the UAE (2022) — the fastest negotiated CEPA in Indian history, completed in 88 days — and the Oman agreement follows the same comprehensive structure.
- The Most Favoured Nation (MFN) principle under WTO rules requires countries to apply the same tariff to all trading partners unless an FTA/CEPA is in place. Before the Oman CEPA, only 15.33% of India’s exports to Oman entered at zero duty under MFN; the agreement expands this to 99.38% by value.
- Oman’s strategic geography: located at the crossroads of the Gulf, Indian Ocean, and East Africa, with major logistics hubs at Sohar, Duqm, and Salalah ports. It provides India not just a destination market but a gateway to the wider GCC and East African economies.
- The Export Inspection Council (EIC), under the Ministry of Commerce, certifies the quality of Indian export goods. Oman’s agreement to accept EIC certificates eliminates duplicative testing — a significant non-tariff barrier reduction for Indian exporters in food and processed goods.
- India’s NPOP (National Programme for Organic Production) and halal certification systems being recognised by Oman opens food, organic produce, and processed food export corridors — particularly relevant for agro-processing clusters in coastal and peninsular states.
- Tariff access transformation: Oman offers duty-free access on 98.08% of tariff lines covering 99.38% of India’s exports by value. Previously only 15.33% entered at zero duty under MFN. This near-universal tariff elimination is the headline gain and provides an immediate competitiveness boost across sectors.
- Textiles & apparel: India holds 43% of Oman’s woven apparel imports and 31% of knitted apparel. The existing 5% tariff removal strengthens Indian competitiveness against China, the other dominant supplier. Gains primarily flow to textile clusters in Tamil Nadu, Gujarat, and Maharashtra.
- Chemicals: India already supplies ~39% of Oman’s inorganic chemical imports. Tariff-free access amplifies an existing dominant position — one of the sectors where the CEPA deepens rather than creates a relationship.
- Engineering goods — the biggest opportunity gap: Oman imports $3.7 billion in mechanical machinery and $3.3 billion in automotives annually, yet India holds only 5% and 2% market share respectively. Preferential access here offers the largest headroom for export expansion, targeting infrastructure, construction, and industrial sectors in Oman’s Vision 2040 development programme.
- Pharmaceuticals — regulatory facilitation model: With ~10% market share, India’s pharmaceutical gain is not tariff-driven but regulatory: products approved by leading international regulators get fast-tracked approvals, reducing compliance costs and accelerating market entry — a template that can be scaled across India’s other CEPA negotiations.
- Agricultural sensitive list: Dairy, cereals, edible oils, and several agricultural commodities are kept outside tariff concessions, ensuring domestic producer protection — a politically necessary carve-out consistent with India’s standard CEPA negotiating posture.
- Services and professional mobility: Bilateral services trade stood at $863 million (2024) with India enjoying a $447 million surplus. Oman has made binding commitments for Indian professionals in accounting, engineering, IT, healthcare, education, and consulting, with increased intra-corporate transferee quotas. AYUSH and traditional medicine provisions add a niche services corridor.
- Trade facilitation: SPS and TBT provisions, fast-track customs clearance for perishables, EIC certificate acceptance, and NPOP/halal recognition reduce non-tariff barriers — often more significant than tariff cuts for small and mid-sized Indian exporters.
- Favour — Strategic diversification: Reduces India’s export concentration risk; deepens the “Act West” economic diplomacy framework alongside Act East; and signals India’s seriousness as a rule-based trading partner at a time when global supply chains are being reorganised away from single-country dependence post-COVID and post-Ukraine.
- Favour — Gateway logic: Oman’s ports (Sohar, Duqm, Salalah) position it as a trans-shipment and logistics hub for the wider GCC (UAE, Saudi Arabia, Qatar, Kuwait, Bahrain) and East Africa — meaning the CEPA’s effective market access extends well beyond Oman’s $11.18 billion bilateral trade figure.
- Favour — Regulatory templates: The pharmaceutical fast-track and EIC acceptance model can become templates for future CEPAs — moving India’s trade negotiation strategy beyond pure tariff reduction toward modern, services- and regulation-oriented economic partnerships.
- Concern — Utilisation risk: Empirical evidence from India’s earlier FTAs (ASEAN, Japan, South Korea) shows that only 20–30% of eligible Indian exports actually use FTA preferences. Paperwork, rules of origin compliance, and awareness gaps reduce real-world gains well below the theoretical tariff access offered by the agreement.
- Concern — Services commitments asymmetry: India’s services surplus with Oman is just $447 million on $863 million of bilateral services trade. While binding Omani commitments are positive, they remain sector-limited; Mode 4 (professional mobility) commitments are subject to Oman’s Omanisation labour policy, which may limit actual Indian professional deployment in practice.
- Concern — Agriculture carve-outs: Keeping dairy, cereals, and edible oils outside concessions is politically understandable but reduces the CEPA’s potential as a vehicle for agricultural export diversification — a missed opportunity given India’s large agri-surplus and Oman’s import dependence for food security.
- FICCI, EEPC, and sector associations must launch CEPA utilisation drives specifically targeting MSMEs in textile clusters (Tamil Nadu), gems and jewellery (Gujarat), engineering (Maharashtra, Punjab), pharmaceuticals (Telangana), and seafood (AP, Kerala) — ensuring the awareness and capacity to comply with rules of origin requirements that determine eligibility for preferential tariffs.
- The PM Gati Shakti National Master Plan must prioritise logistics connectivity from India’s export clusters to Gujarat’s Mundra and Kandla ports — the natural sea-route gateways to Oman — to ensure that tariff wins are not eroded by inland transport and port handling costs that reduce the actual competitiveness of Indian exports at the Omani border.
- India should leverage the Oman CEPA gateway logic by establishing dedicated India-Oman business councils at Sohar and Duqm free zones, enabling Indian firms to use Oman as a manufacturing and re-export base for the wider GCC market — mirroring how some Indian companies have used UAE free zones under the UAE CEPA.
- The pharmaceutical fast-track model (internationally approved products getting expedited Omani approval) should be replicated in ongoing CEPA negotiations with the EU and GCC bloc — building a regulatory facilitation template that amplifies India’s comparative advantage in generics without depending solely on tariff reduction.
- Other India CEPAs (for context): UAE (2022, fastest at 88 days), Australia (2022 interim, 2023 full), EFTA (2024), UK (negotiations ongoing), EU (negotiations ongoing). Oman is the 15th FTA partner-country group for India.
- Oman’s key ports: Sohar Industrial Port (linked to aluminium, petrochemicals), Duqm Special Economic Zone (targeting heavy industry, tourism), Salalah (major trans-shipment hub on East-West shipping lanes) — all accessible under CEPA investment provisions.
- Intro: India-Oman historic ties; CEPA in force June 1, 2026; place it in India’s expanding CEPA network (UAE, Australia, EFTA, UK); frame as part of “Act West” economic diplomacy.
- Body 1 — Economic gains: 98.08% tariff lines duty-free; textiles (5% tariff removal, 43% market share), chemicals (39% share), engineering goods (5–2% share — big headroom), pharmaceuticals (regulatory fast-track). Data grid figures.
- Body 2 — Strategic dimensions: Oman as GCC gateway; Sohar-Duqm-Salalah ports; East Africa access; services mobility (IT, healthcare, AYUSH); energy security and diaspora dimensions; Oman’s Vision 2040 creating infrastructure demand India can supply.
- Body 3 — Challenges: FTA utilisation gap (20–30% historically); rules of origin compliance burden for MSMEs; agricultural carve-outs limiting agri-export diversification; Omanisation labour policy constraining Mode 4 professional mobility commitments.
- Conclusion: Gateway logic > bilateral trade stats. CEPA utilisation drives via FICCI and sector associations, PM Gati Shakti port connectivity, and pharma regulatory template as way forward.
Consider the following statements about the India-Oman CEPA (in force June 1, 2026):
1. Before the CEPA, over 80% of India’s exports to Oman entered at zero duty under the MFN regime.
2. Oman has offered duty-free access on 98.08% of its tariff lines, covering 99.38% of India’s exports by value.
3. The CEPA provides for regulatory fast-tracking of Indian pharmaceutical products approved by recognised international regulators.
4. Dairy, cereals, and edible oils are fully included in Oman’s tariff concession schedule under the CEPA.
Which of the above statements are correct?
Statement 1 — Wrong. Before the CEPA, only 15.33% of India’s exports entered Oman at zero duty under MFN. The CEPA transforms this to 99.38% coverage by value.
Statement 2 — Correct. Oman offers duty-free on 98.08% of tariff lines covering 99.38% of India’s exports by value. A near-total elimination of tariff barriers.
Statement 3 — Correct. Pharmaceuticals approved by leading international regulators get fast-tracked approvals in Oman — a regulatory facilitation model rather than a tariff reduction model, given that tariffs on pharma were already low.
Statement 4 — Wrong. Dairy, cereals, edible oils, and several agricultural commodities are explicitly kept outside tariff concessions to protect Indian domestic producers — a standard carve-out in India’s CEPA negotiating template.
Fifteen FTAs, 27 Countries, Four Challenges
- With the India-Oman CEPA in force, India now has 15 FTAs covering 27 countries. Nine more agreements covering 42 countries are nearing completion — which would take India’s FTA network to 69 countries accounting for ~75% of India’s exports, a dramatic expansion of trade treaty coverage over the past decade.
- The author argues that this rapid FTA expansion, while strategically sound in intent, is producing four structural challenges that are damaging India’s manufacturing competitiveness, widening trade deficits, and encouraging firms to produce abroad and sell to India rather than producing in India for domestic and export markets.
- The core diagnostic: India’s trade-weighted MFN tariff (~12.6%) is significantly higher than FTA partners (near zero in Singapore, below 4% in Japan/Australia/Malaysia/UAE), creating a fundamental asymmetry where FTAs give foreign exporters a major advantage in the Indian market while providing limited additional access for Indian exporters in already-open partner markets.
- The article calls for structural reform of India’s tariff architecture — particularly on industrial inputs — to ensure FTAs strengthen domestic manufacturing rather than inadvertently hollowing it out by incentivising “Make in ASEAN, Sell in India.”
- India’s FTA history: Early agreements with ASEAN (goods 2010, services 2012), Japan (2011), South Korea (2010), Singapore (CECA, 2005), Sri Lanka (1998), Nepal, Bhutan, Thailand, Malaysia. Pre-2022, all were relatively cautious agreements; the UAE CEPA (2022) marked a strategic acceleration.
- Rules of Origin (RoO) are criteria that determine whether a product qualifies as originating from an FTA partner country and thus eligible for preferential tariffs. Complex RoO increase the compliance cost for exporters; this is a key reason why Indian exporters underuse FTA preferences even when they exist.
- An Inverted Duty Structure arises when import duties on inputs (raw materials, components) are higher than duties on finished products. This disadvantages domestic manufacturers by raising their input costs while exposing them to duty-free competition from fully assembled imports. It directly undermines “Make in India” objectives.
- The ASEAN-China FTA has enabled Chinese investment in Vietnam, Thailand, Indonesia, and Malaysia to use these countries as export platforms into India under the India-ASEAN FTA — a phenomenon called tariff arbitrage or FTA-shopping, which the article flags as a structural consequence of India’s tariff asymmetry.
- India’s trade-weighted MFN tariff (~12.6%) compares unfavourably to Singapore (near zero), Japan (<4%), Australia (<4%), Malaysia (<4%), UAE (<4%). In India, only ~6% of imports enter duty-free under MFN — compared to 80%+ in Japan and Malaysia, and 50%+ in EU and UK.
- Challenge 1 — Rising trade deficits: India’s trade deficit with ASEAN grew 381% between 2007–09 and 2023–25; with Japan 318%; with South Korea 268% — compared to 142% with the rest of the world. In FY2025, India exported $48.6 billion to UAE, Australia, Mauritius and EFTA but imported ~$100 billion — a $50+ billion deficit from these FTA partners alone.
- Challenge 2 — Low FTA utilisation by Indian exporters: Only an estimated 20–30% of India’s eligible exports actually use FTA preferences. When partner-country MFN tariffs are already near zero, the incentive to comply with rules of origin (CoO paperwork, value-addition tests) is weak since the tariff savings are too small to justify compliance costs. In contrast, import-side utilisation is 60–70% because India’s higher MFN tariffs make the savings from FTA preferences large and worth claiming.
- Challenge 3 — Inverted duty structures: Steel and aluminium face 7.5–10% MFN duties in India, but machinery and engineering products made from them can enter duty-free under multiple FTAs. Similarly, chemical inputs (caustic soda, soda ash, polypropylene, PVC, SBR) attract duties while downstream finished goods enter at low or zero tariff — raising production costs for Indian manufacturers relative to duty-free imports, undermining Make in India.
- Challenge 4 — Make in ASEAN, Sell in India: When it is cheaper to manufacture in Vietnam/Thailand/Indonesia and export duty-free to India than to produce in India, investment and jobs migrate abroad. Chinese companies have invested heavily in ASEAN for precisely this purpose; some Indian firms too have set up factories there for duty-free re-entry into the Indian market. This is the most structurally damaging outcome: FTAs actively incentivising offshoring from India.
- Asymmetry mechanics: India’s 12.6% trade-weighted MFN tariff vs near-zero rates in most FTA partners means a 50% tariff cut under an FTA gives a foreign exporter a major cost advantage in India, while the same cut for an Indian exporter into a partner country often saves nothing because the partner’s pre-FTA tariff was already near zero.
- South Asia exception: India’s trade surplus with South Asia (SAARC) expanded from $6.7 billion to $20 billion over the same period — the one regional bloc where India is the open economy relative to partners, reversing the asymmetry that plagues FTAs with developed and ASEAN partners.
- Favour — FTAs remain necessary: Despite the four challenges, not having FTAs carries its own cost — Indian exporters face higher tariffs in partner markets than competitors from countries that do have FTAs (e.g., EU or ASEAN countries). Being outside FTA networks risks Indian exports being systematically displaced in third-country markets by more-preferred suppliers.
- Favour — Services and investment dimension: The critique focuses heavily on goods trade deficits. India’s services sector — where India has structural comparative advantage (IT, financial services, AYUSH, education) — benefits significantly from FTA Mode 4 and Mode 3 commitments. The deficit calculus changes materially when services are incorporated into the bilateral balance.
- Concern — Tariff asymmetry is structural and persistent: India cannot rapidly reduce its MFN tariffs on industrial inputs without affecting domestic industries that depend on that protection. Yet without doing so, the inverted duty problem worsens with every new FTA signed. This creates a policy trap: negotiate more FTAs to improve export access while simultaneously deepening the domestic manufacturing cost disadvantage.
- Concern — China’s ASEAN proxy: The author correctly identifies that India’s FTAs with ASEAN have indirectly benefited China-origin goods routed through ASEAN production platforms. Weak rules of origin in the India-ASEAN FTA — particularly the “change in tariff classification” standard — make it relatively easy to claim ASEAN origin with minimal value addition in the partner country.
- Concern — Investment outflow risk: If the Make in ASEAN trend deepens, PLI (Production Linked Incentive) scheme gains in electronics, pharmaceuticals, and textiles could be partially offset by Indian companies themselves investing abroad to access the Indian market at lower tariffs. This would reduce the domestic employment and value-addition multiplier that PLI is designed to generate.
- Rationalise input tariffs under ITAF: The Inverted Tariff Anomaly Framework (through Union Budget and CBIC) must systematically reduce duties on key industrial inputs — steel, aluminium, chemical intermediates, electronics components — to align India’s cost structure with global norms, eliminating the inverted duty trap without waiting for FTA negotiation cycles.
- Strengthen Rules of Origin: The India-ASEAN FTA must be renegotiated to adopt stricter RoO — minimum value addition requirements of 40–50% rather than mere change-of-tariff-heading tests — to prevent China-origin goods from gaining preferential access to India through minimal ASEAN processing. This is a key structural defence against the “Make in ASEAN, Sell in India” phenomenon.
- Build an FTA Utilisation Cell within DPIIT and Commerce Ministry tasked exclusively with raising Indian exporter utilisation from ~25% to 60%+ through standardised CoO documentation, digital certification platforms, and sector-specific awareness campaigns targeting the MSMEs and smaller exporters who bear disproportionate compliance costs relative to tariff savings.
- Apply Trade Adjustment Assistance from FTA savings (domestic industries benefiting from reduced input tariffs) to support workers and industries adversely affected by import surges — building the political economy for further tariff rationalisation without triggering protectionist backlash from domestic producer lobbies.
- India-ASEAN FTA context: Goods FTA operational since 2010; India’s deficit with ASEAN grew 381% post-FTA vs 142% with rest of world — the clearest empirical case for the structural asymmetry argument; review of RoO has been pending since 2018, with ASEAN members resisting tighter origin requirements.
- South Asia exception data: India’s surplus with South Asia grew from $6.7 billion to $20 billion (2007–09 to 2023–25) — the one region where India is the more open economy, confirming that the asymmetry hypothesis holds in reverse when India’s tariffs are lower than the partner’s.
- Intro: India’s 15 FTAs covering 27 countries; 9 more pending; 75% of exports covered; frame as both opportunity and structural challenge. India’s RCEP withdrawal (2020) as a policy signal of concern.
- Body 1 — Four challenges: Rising deficits (ASEAN +381%, Japan +318%, South Korea +268%); low utilisation by Indian exporters (20–30% vs 60–70% import-side); inverted duty structures (steel/aluminium 7.5–10% vs duty-free finished goods); Make in ASEAN phenomenon (Chinese investment in Vietnam/Thailand/Indonesia targeting Indian market).
- Body 2 — Root cause: India’s MFN tariff (~12.6%) vs near-zero in FTA partners; only 6% of India’s imports enter duty-free under MFN vs 80%+ in Japan/Malaysia. Asymmetry means FTAs benefit foreign exporters in India far more than Indian exporters abroad.
- Conclusion: Not anti-FTA but pro-reform. Tighten RoO in India-ASEAN FTA; rationalise input tariffs through annual Budget; build FTA Utilisation Cell; apply PLI-type incentives to sectors most exposed to FTA-driven competition. South Asia surplus proves the asymmetry thesis — fix the tariff structure, not the treaty-making.
Consider the following statements about India’s FTA trade outcomes:
1. India’s trade deficit with ASEAN grew by 381% between 2007–09 and 2023–25, compared to 142% with the rest of the world.
2. An estimated 60–70% of India’s eligible exports use FTA preferential tariffs, while only 20–30% of eligible imports do so.
3. India’s trade-weighted MFN tariff is approximately 12.6%, significantly higher than most of its FTA partner countries.
4. India’s trade surplus with South Asia expanded from $6.7 billion to $20 billion over the same period as FTA-linked deficits grew with ASEAN and East Asia.
Which of the above statements are correct?
Statement 1 — Correct. India’s trade deficit with ASEAN grew 381% post-FTA versus 142% with the rest of the world — the primary empirical argument for tariff asymmetry driving import surges.
Statement 2 — Wrong. The utilisation figures are reversed. Indian exporters use FTA preferences at only 20–30% (export-side), while the import-side utilisation is 60–70%. Foreign exporters have stronger incentive to use FTA preferences because India’s MFN tariffs are high, making the savings large. Indian exporters face already-low tariffs in partner markets, making compliance costs relatively unattractive.
Statement 3 — Correct. India’s trade-weighted MFN tariff is ~12.6%, versus near-zero in Singapore and below 4% in Japan, Australia, Malaysia, and UAE. This asymmetry is the structural root cause of all four FTA challenges.
Statement 4 — Correct. India’s surplus with South Asia expanded from $6.7 billion to $20 billion — confirming the asymmetry thesis in reverse: where India is the more open economy, it benefits from FTA-like regional trade dynamics.


