Introduction
Indian population may overtake the population of China within the next couple of decades, eventually making India the most populous nation of the world. It is in this way the population is quite often seen as a liability, a major hindrance to development and quality of life of the people. Such a large population invariably puts pressure on a country’s limited resources and is also responsible for many socio-economic problems in the country. But is it true? Let’s think and understand. Has population not been an asset, a resource for the country? Today, India is considered as a leading nation in the world in terms of human power. One of the major contributing factors for this global standing has been the young, educated and productive people of our country. They are contributing to the development of not only our country, but many of the foreign countries also. In this context, population is an asset for the economy, the greatest resource of the country rather than a liability.
Demography is the science of systematic study of population.
How to Determine Population Trends?
Census: For example, the Economic Census in India is a Central Sector Scheme, with 100% Central Assistance and is conducted in all the States and Union Territories of the country, in collaboration with State/UT Governments., Survey: The National Sample Survey Office (NSSO) in India is a unique setup to carry out surveys on socio-economic, demographic, agricultural and industrial subjects for collecting data from house-holds and from enterprises located in villages and in the towns.
Distribution and Density of Population
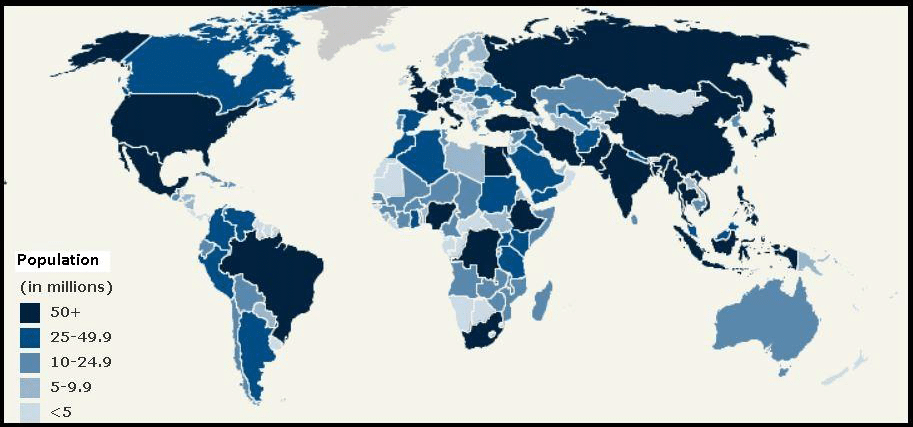
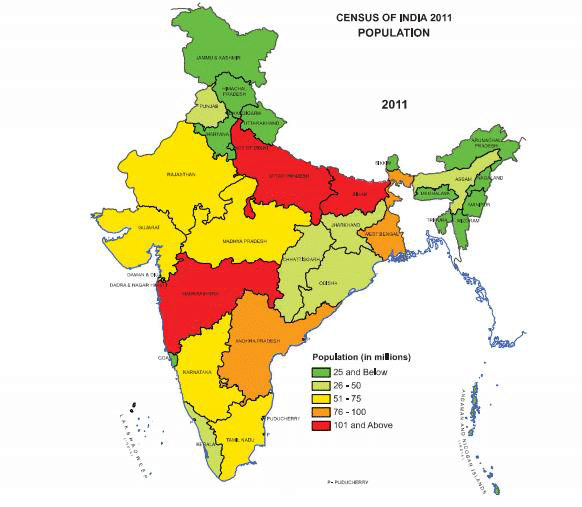
The term ‘Population Distribution’ refers to the way people are spaced over the earth’s surface. Broadly, 90 per cent of the world population lives in about 10 per cent of its land area. India’s population as on March 2011 stood at 1,210 million, which account for approx. 17% of the world’s population. These 1.21 billion people are unevenly distributed over our country’s vast area of 3.28 million square km, which accounts for 2.4 per cent of the world’s area.
World Distribution of Population
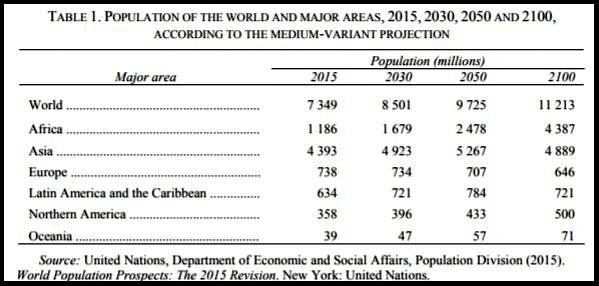
According to World Population Prospects: 2015, the world population reached 7.3 billion as of mid-2015. Sixty per cent of the global population lives in Asia (4.4 billion), 16 per cent in Africa (1.2billion), 10 per cent in Europe (738 million), 9 per cent in Latin America and the Caribbean (634 million),and the remaining 5 per cent in Northern America (358 million) and Oceania (39 million). China (1.4 billion) and India (1.3 billion) remain the two largest countries of the world, both with more than 1 billion people, representing 19 and 18 per cent of the world’s population, respectively. In 2015, 50.4 per cent of the world’s population is male and 49.6 per cent is female. The median age of the global population, that is, the age at which half the population is older and half is younger, is 29.6 years. About one-quarter (26 per cent) of the world’s people is under 15 years of age, 62 per cent are aged 15-59 years, and 12 per cent are 60 or over.
Distribution of Population in India
India’s Population Distribution by Density:
Density of population is expressed as number of persons per unit area. It helps in getting a better understanding of the spatial distribution of population in relation to land. Population density provides a better picture than total population especially when the population is unevenly distributed.
The density of population in India (2011) is 382 persons per sq km. There has been a steady increase of about 265 persons per sq km over the last 60 years as the density of population increased from 117 persons/ sq km in 1951 to 382 persons/sq km in 2011.
Factors Influencing the Distribution of Population
Geographical Factors
• Availability of water
• Landforms (Relief)
• Climate.
• Soils
Economic Factors
• Minerals
• Urbanisation: better means of transport and communication.
• Industrialization
Social and Cultural Factors
Some places attract more people because they have religious or cultural significance. In the same way – people tend to move away from places where there is social and political unrest. Many a time governments offer incentives through various types of policies to people to live in sparsely populated areas or move away from overcrowded places.
Population change
The population growth or population change refers to the change in number of inhabitants of a territory during a specific period of time. This change may be positive as well as negative. It can be expressed either in terms of absolute numbers or in terms of percentage. Population change in an area is an important indicator of economic development, social upliftment and historical and cultural background of the region.
Determinants of Population Change
- FERTILITY
Total Fertility Rate: The total fertility rate refers to the total number of live births that a woman would have if she lived through the reproductive age group and had the average number of babies in each segment of this age group as determined by the age-specific fertility rates for that area.
Fecundity and fertility. Fecundity refers to the physiological capacity to reproduce. Fertility, on the other hand, refers to the actual reproductive performance of an individual or a group.
Determinants of High Fertility
a) Religious Ideologies
b) Universality of the institution of marriage.
c) Early marriage and early child-bearing.
d) Preference for sons ingrained in the Indian culture.
e) Lack of right of self-determination with reference to reproduction.
f) High infant and child mortality rates – (unsatisfactory health, low nutritional status and poverty) also contribute to a large family size.
g) Economic, social, cultural as well as religious value of children in the Indian society.
h) Absence of adoption of methods of conception control.
Implications of High Fertility
- Women are tied down to child-bearing and child-rearing for the best years of their productive lives. They are, therefore, denied the opportunity to explore other avenues for self-expression and self-development. This could lead to frustration.
- Excessive child-bearing affects their own health and that of their children.
- The burden of providing for a large family sits heavily on the bread-winner of the family.
- The children, often unwanted, unloved and neglected, are left to their own to make life bearable. The children in large families often have to start working at a very early age to supplement the slender financial resources of the family. They even indulge in delinquency and are, therefore, denied the opportunity to go to school and get educated.
- The girl child is the worst sufferer in these circumstances. She is often not sent to school at all, or is withdrawn from school at an early age to help her mother in carrying out domestic chores and to look after her younger siblings when the mother is at work.
- Early marriage pushes her into child-bearing, and the vicious cycle continues.
- MORTALITY
Infant Mortality Rate: Infants are defined in demography as all those children in the first year of life who have not yet reached age one.
As per the Sample Registration System (SRS) Reports published by the Registrar General of India, the Infant Mortality Rate (IMR) in the country has declined steadily from 47/1000 live births in 2010 to 40/1000 live births in 2013.
United Nations has recently set Sustainable Development Goals and Targets. The target for India is to attain Under 5 Mortality Rate of 25/1000 live births by 2030.
Maternal Mortality Rate: The maternal mortality ratio represents the risk associated with each pregnancy, i.e. the obstetric risk. Maternal death is the death of a woman while pregnant or within 42 days of termination of pregnancy, irrespective of the duration and site of the pregnancy, from any cause related to or aggravated by the pregnancy or its management but not from accidental or incidental causes.
It is measured as number of maternal deaths per 100000 live births.
As per Sample Registration System (SRS), 2011-13 reports Maternal Mortality Ratio (MMR) is 167 per 1,00,000 live births in the Country
- MIGRATION
Immigration: Migrants who move into a new place are called Immigrants.
Emigration: Migrants who move out of a place are called Emigrants.
People migrate for a better economic and social life. There are two sets of factors that influence migration.
The Push factors make the place of origin seem less attractive for reasons like unemployment, poor living conditions, political turmoil, unpleasant climate, natural disasters, epidemics and socio-economic backwardness.
The Pull factors make the place of destination seem more attractive than the place of origin for reasons like better job opportunities and living conditions, peace and stability, security of life and property and pleasant climate.
Migration can be internal (within the country) or international (between the countries).
Natural Growth of Population: This is the population increased by difference between births and deaths in a particular region between two points of time.
Natural Growth= Births-Deaths
Actual Growth of Population=Births – Deaths + in Migration – out Migration


