Focus: GS-III Indian Economy, Prelims
Why in news?
Retail inflation based on the Consumer Price Index slowed to 6.58% in February, while the industrial production growth as measured in the Index of Industrial Production (IIP) quickened to 2% in January amid subdued performance by the manufacturing sector, official data released on 12th March 2020 showed.
Details
- Retail inflation, which was 7.59% in January 2020 and 2.57% in February 2019, slowed mainly due to easing food prices. Inflation in the food basket was 10.81% February 2020, lower from 13.63% in the previous month, as per data from Ministry of Statistics and Programme Implementation.
- The government has mandated the central bank to keep inflation at 4% with a margin of two percentage points on either side.
- Cumulative IIP growth for the period April-January 2019-20 over the corresponding period of the previous year stands at 0.5%, as against a growth of 4.4% in the corresponding period of 2018-19.
Inflation
Inflation is defined as a situation where there is sustained, unchecked increase in the general price level and a fall in the purchasing power of money.
Thus, inflation is a condition of price rise. The reason for price rise can be classified under two main heads : (1) Increase in demand (2) Reduced supply.
Causes of Inflation
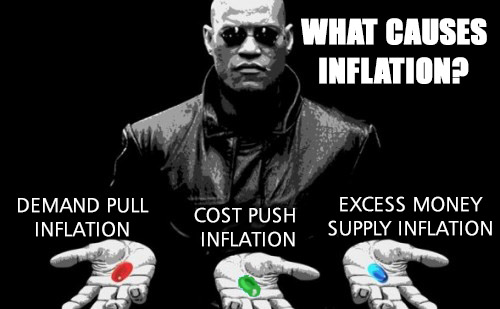
- Demand-pull inflation is the most common cause of rising prices. It occurs when consumer demand for goods and services increases so much that it outstrips supply. Producers can’t make enough to meet demand.
- Cost-Push Inflation only occurs when there is a supply shortage combined with enough demand to allow the producer to raise prices.
Consumer Price Index
The Consumer Price Index (CPI) is a measure that examines the weighted average of prices of a basket of consumer goods and services, such as transportation, food, and medical care.
It is calculated by taking price changes for each item in the predetermined basket of goods and averaging them. Changes in the CPI are used to assess price changes associated with the cost of living; the CPI is one of the most frequently used statistics for identifying periods of inflation or deflation.
IIP
- The IIP is a composite indicator that measures the changes in the volume of production of a basket of industrial products during a given period with respect to the volume of production in a chosen base period. The data refers to the General Index as well as for each industry group.
- The industry groups that it measures are classified under the following:
- Broad sectors like manufacturing, mining and electricity.
- Use-based sectors like capital goods, basic goods, intermediate goods, infrastructure goods, consumer durables and consumer non-durables.
The eight core industries of India represent about 40% of the weight of items that are included in the IIP. The Eight Core Sectors/Industries are:
- Electricity
- Steel
- Refinery products
- Crude oil
- Coal
- Cement
- Natural gas
- Fertilisers


